Fig. A.5
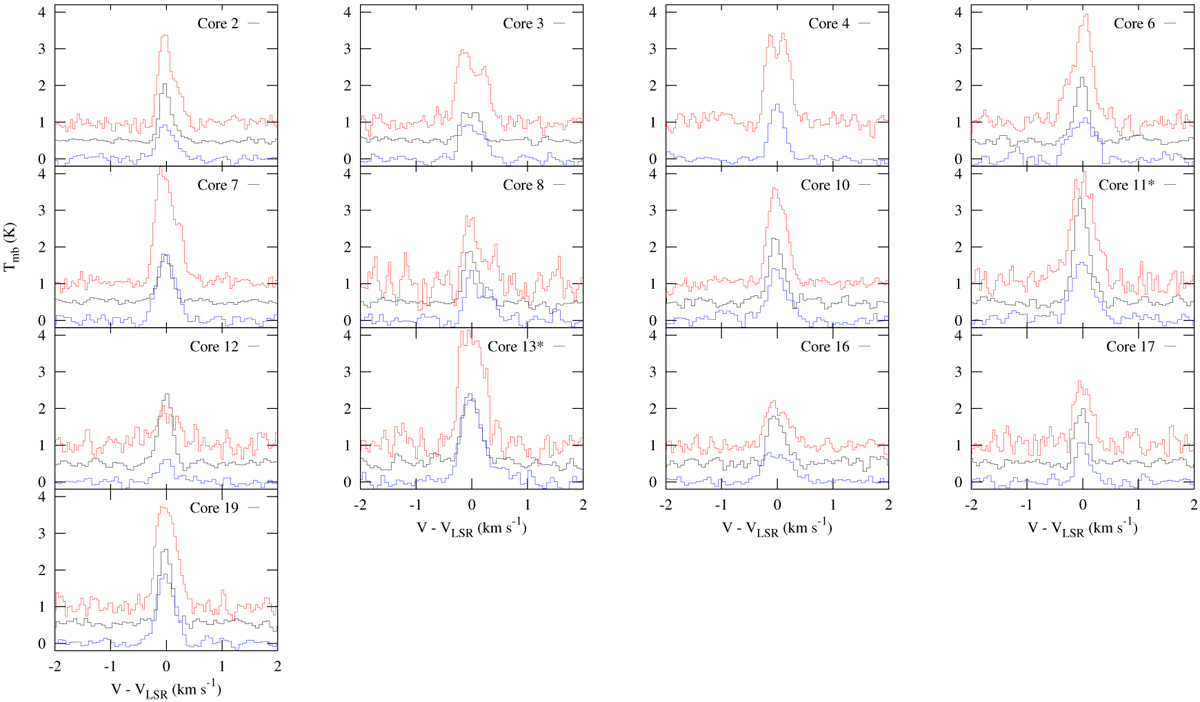
Spectra of the isolated components of N2H+(1–0) (black), DCO+(2–1) (red), and H13CO+(1–0) (blue) towards the N2H+(1–0) emission peaks. For convenient comparison, the DCO+(2–1) spectra are shifted up by 1 K and the N2H+(1–0) spectra are shifted up by 0.5 K. The cores with an asterisk (*) near the title contain embedded protostrars.
Current usage metrics show cumulative count of Article Views (full-text article views including HTML views, PDF and ePub downloads, according to the available data) and Abstracts Views on Vision4Press platform.
Data correspond to usage on the plateform after 2015. The current usage metrics is available 48-96 hours after online publication and is updated daily on week days.
Initial download of the metrics may take a while.