Free Access
Fig. A.3
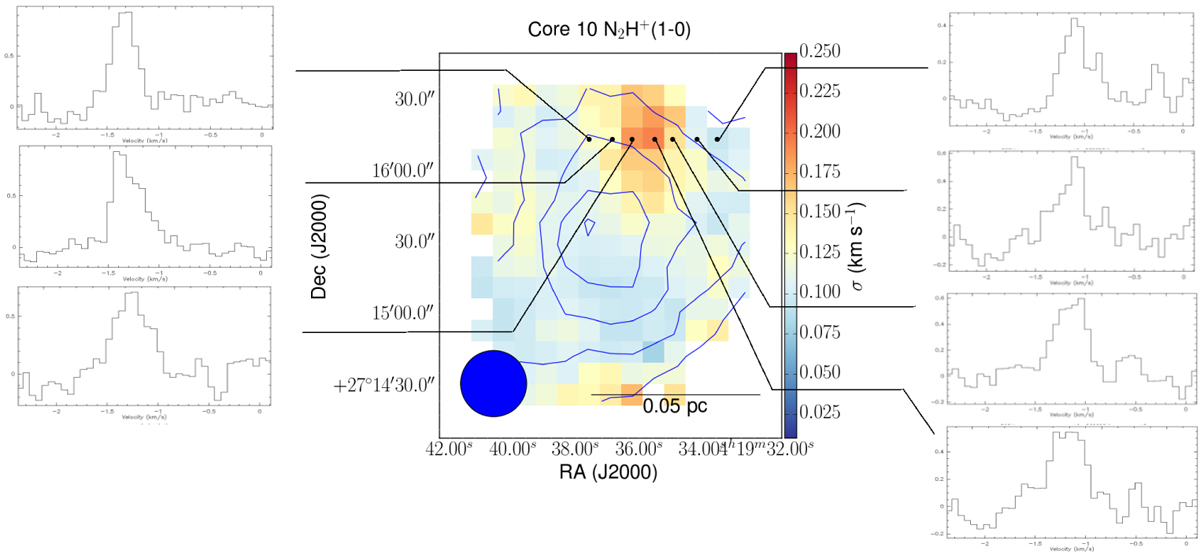
Velocity dispersion map of N2H+(1–0) towards core 10 with a sample of the gas flow on the edge of the core connecting it to the envelope and the isolated components spectra.
Current usage metrics show cumulative count of Article Views (full-text article views including HTML views, PDF and ePub downloads, according to the available data) and Abstracts Views on Vision4Press platform.
Data correspond to usage on the plateform after 2015. The current usage metrics is available 48-96 hours after online publication and is updated daily on week days.
Initial download of the metrics may take a while.