Fig. A.2
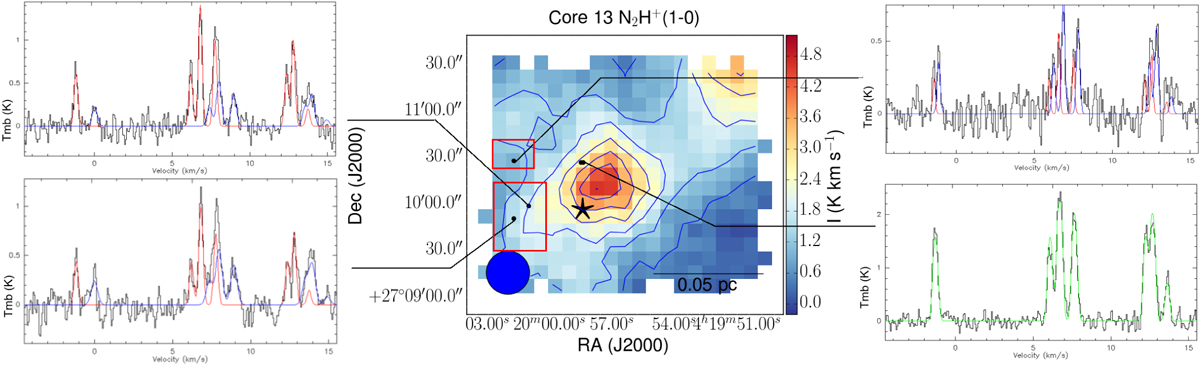
Integrated intensity map of N2H+(1–0) towards core 13. The red boxes in the map show the areas where the additional velocity components are present. Left panel: the second velocity component (blue fit) is well separated (by ≃1 km s−1) from the main velocity component (red fit). Right top panel: the second velocity component (red fit)is partially blended with the main velocity component (blue fit, the separation is ≃0.3 km s−1 which corresponds to a linewidth σ = 0.13 km s−1). Bottom right panel shows an example spectrum in which only one velocity component is detected with the best fit shown as the greenline.
Current usage metrics show cumulative count of Article Views (full-text article views including HTML views, PDF and ePub downloads, according to the available data) and Abstracts Views on Vision4Press platform.
Data correspond to usage on the plateform after 2015. The current usage metrics is available 48-96 hours after online publication and is updated daily on week days.
Initial download of the metrics may take a while.