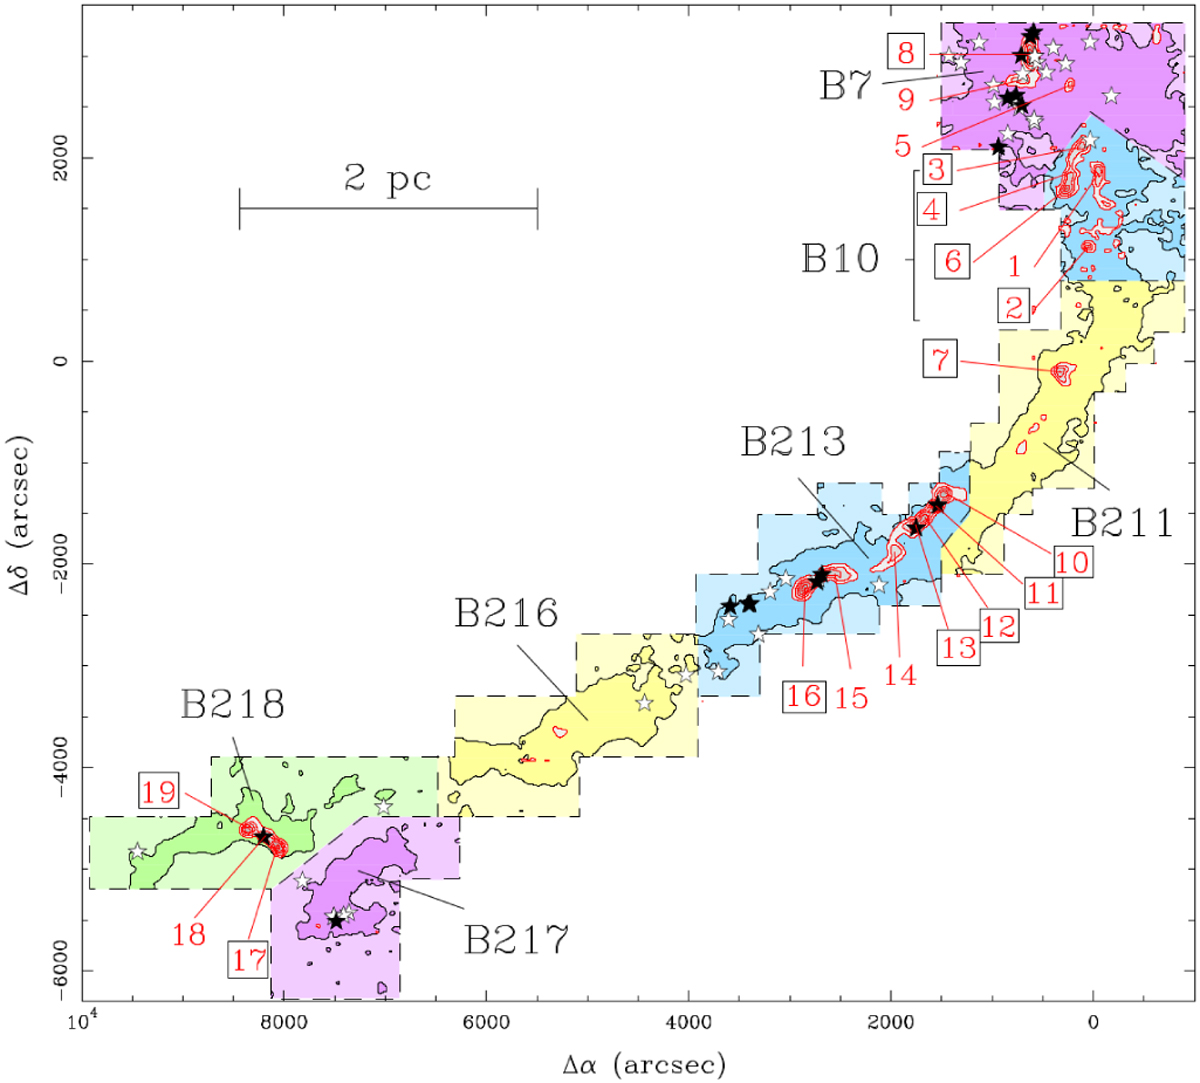
Fig. 1

Schematic view of the selected L1495 filament within the Taurus Molecular Cloud Complex (adapted from Hacar et al. 2013). The offsets refer to the centre at α = 4h 17m47.1s, δ = +27°37′18′′ (J2000). Theblack solid line represents the lowest C18O(1–0) contour (0.5 K km s−1). The red linesrepresent the N2H+(1–0) emission (first contour and contour interval are 0.5 K km s−1), which traces the dense cores. The C18O(1–0) and N2H+(1–0) data are from Hacar et al. (2013). The red labels identify the cores found by Hacar et al. (2013), and black squares around the labels show the cores studied in this work. The stars correspond to young stellar objects from the survey of Rebull et al. (2010). Solid symbols represent the youngest objects (Class I and Flat), and open symbols represent evolved objects (Class II and III).
Current usage metrics show cumulative count of Article Views (full-text article views including HTML views, PDF and ePub downloads, according to the available data) and Abstracts Views on Vision4Press platform.
Data correspond to usage on the plateform after 2015. The current usage metrics is available 48-96 hours after online publication and is updated daily on week days.
Initial download of the metrics may take a while.


