Fig. 9.
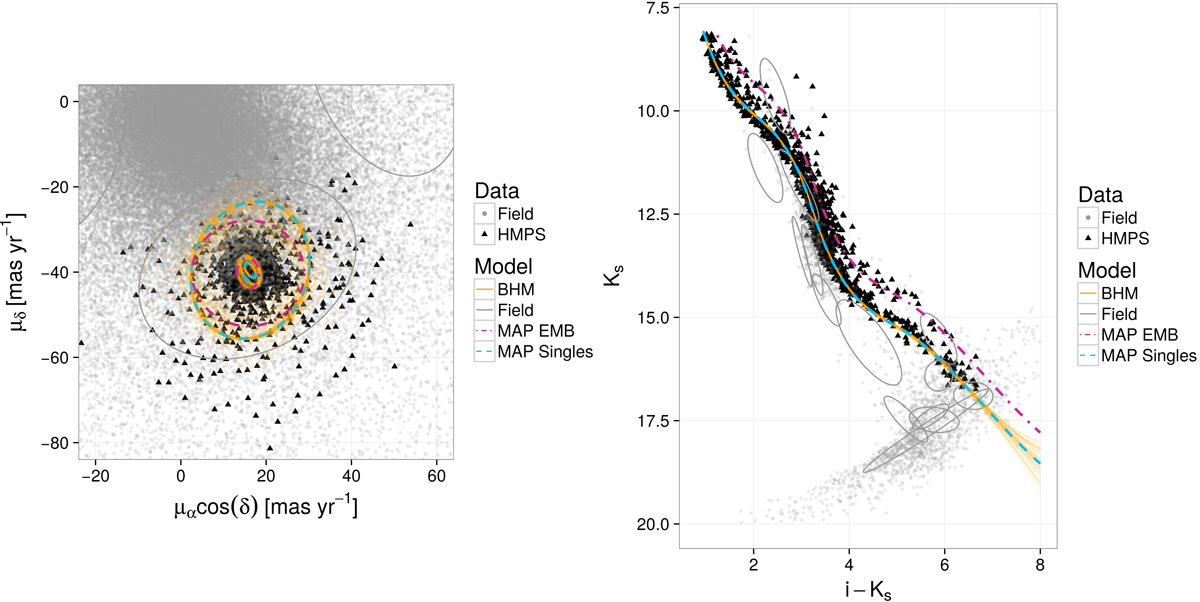
Proper motion (left) and Ks vs. i−Ks CMD (right) projections of cluster and field models and objects in our dataset. Our candidate members in the HMPS are in black triangles and the field objects in grey dots. Grey ellipses delineate the covariance matrices of the field GMM. The cluster model is represented by the MAP (dot-dashed and dashed lines labelled as MAP EMB and MAP Singles corresponding to equal-mass binaries and single stars, respectively) and 100 samples (orange lines) of the posterior distributions.
Current usage metrics show cumulative count of Article Views (full-text article views including HTML views, PDF and ePub downloads, according to the available data) and Abstracts Views on Vision4Press platform.
Data correspond to usage on the plateform after 2015. The current usage metrics is available 48-96 hours after online publication and is updated daily on week days.
Initial download of the metrics may take a while.