Fig. 6.
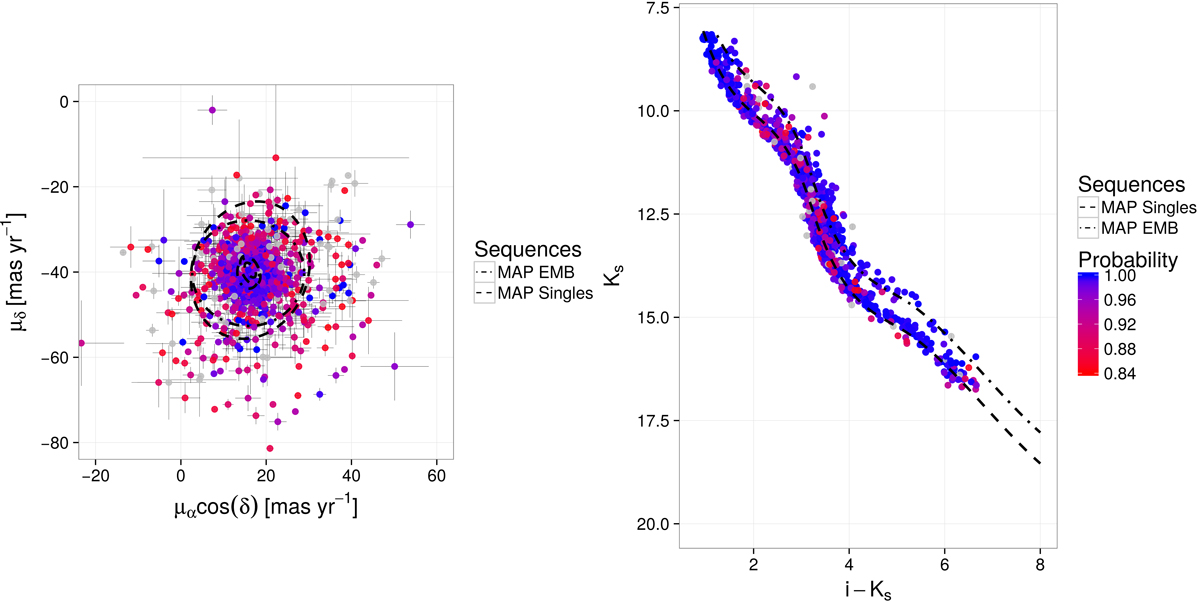
Proper motion (left) and Ks vs. i−Ks CMD (right) of our candidate members (HMPS, see text). Grey dots depict candidate members whose cluster membership probability is below the probability threshold pt but are only included because it sensitivity to the cluster parameters reaches the pt. The lines represent the MAP of the parameters in the equal-mass binaries (dot-dashed line labelled as MAP EMB) and single stars (dashed line labeled as MAP Singles) models. Standard uncertainties in photometry are in general smaller than symbols.
Current usage metrics show cumulative count of Article Views (full-text article views including HTML views, PDF and ePub downloads, according to the available data) and Abstracts Views on Vision4Press platform.
Data correspond to usage on the plateform after 2015. The current usage metrics is available 48-96 hours after online publication and is updated daily on week days.
Initial download of the metrics may take a while.