Fig. 5.
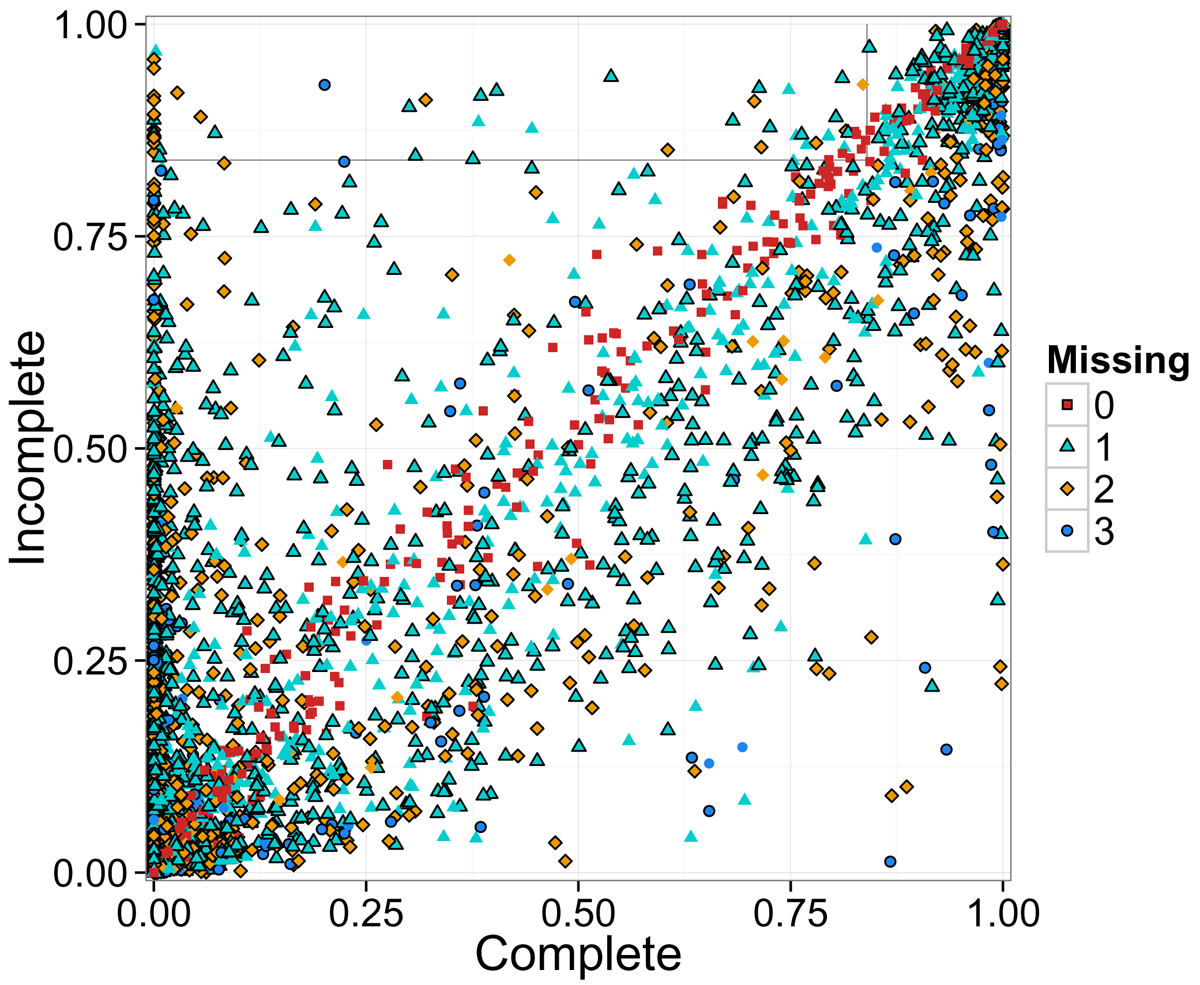
Comparison between the cluster membership probabilities recovered from the synthetic data with missing values (incomplete) and without them (complete). The colour and shape indicate the amount of missing values. The symbols enclosed in black indicate a missing CI. The top left box contains objects considered as contaminants due to missing values, at the probability threshold pt = 0.84.
Current usage metrics show cumulative count of Article Views (full-text article views including HTML views, PDF and ePub downloads, according to the available data) and Abstracts Views on Vision4Press platform.
Data correspond to usage on the plateform after 2015. The current usage metrics is available 48-96 hours after online publication and is updated daily on week days.
Initial download of the metrics may take a while.