Fig. 4.
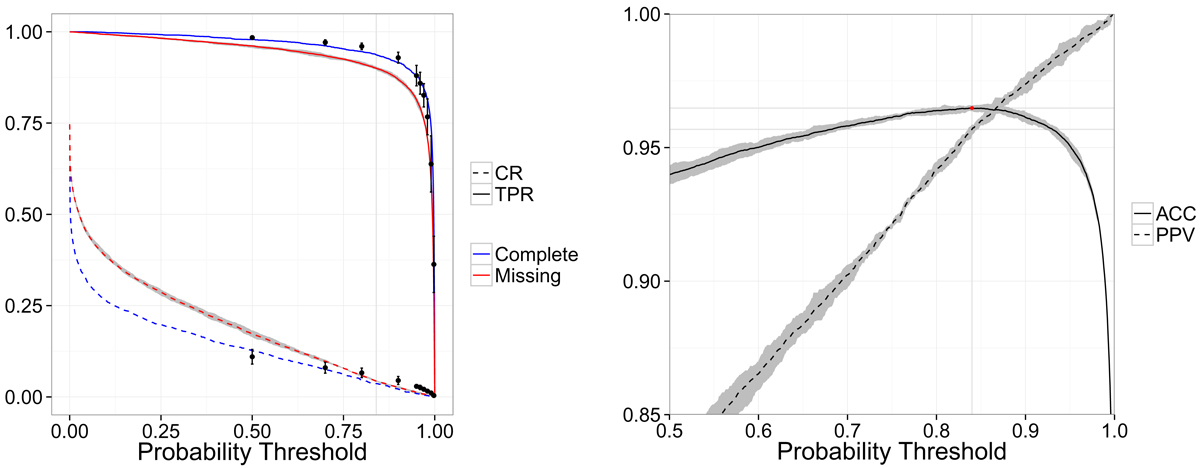
Left: TPR (solid line) and CR (dashed line) of our methodology when applied on synthetic data sets with and without missing values (red and blue lines, respectively). Black dots show the TPR and CR reported by Sarro et al. (2014) for their non-missing values model. Right: accuracy and precision as a function of probability threshold for our classifier when applied on synthetic data with missing values. The highest accuracy is obtained at pt = 0.84 (red dot). In both panels, the grey areas show the maximum deviations from the mean of the results of the five missing-values synthetic data sets.
Current usage metrics show cumulative count of Article Views (full-text article views including HTML views, PDF and ePub downloads, according to the available data) and Abstracts Views on Vision4Press platform.
Data correspond to usage on the plateform after 2015. The current usage metrics is available 48-96 hours after online publication and is updated daily on week days.
Initial download of the metrics may take a while.