Fig. 3.
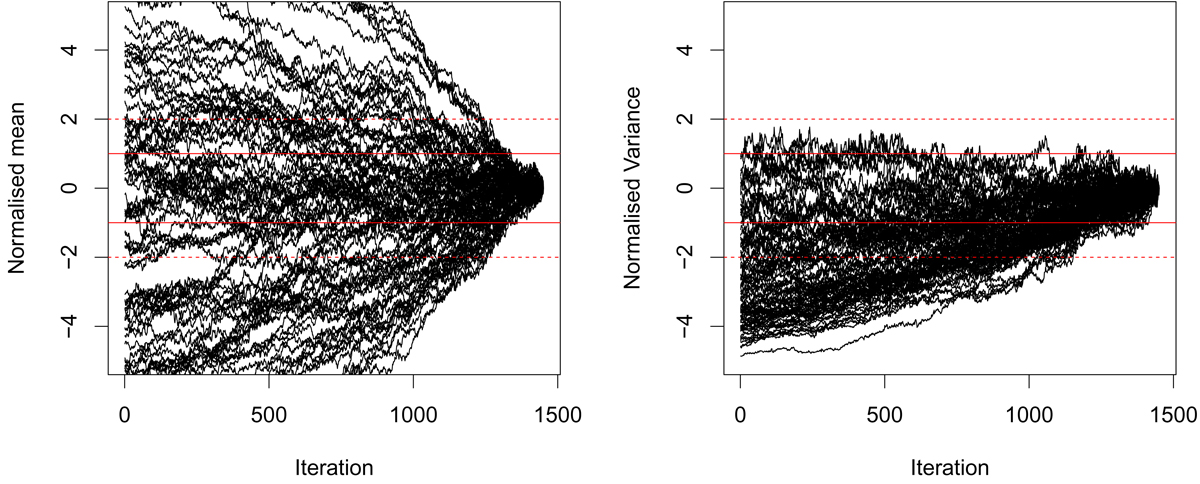
Normalised mean (left panel) and variance (right panel) of each parameter in our model, given the DANCE DR2 data set as functions of iterations in the MCMC. Each parameter is scaled using the mean and variance of its corresponding ensemble of particles positions at the last iteration. Red lines show one and two sigma levels of these normalisation values. These figures depict the evolution of the Markov Chains from the original values provided by the PSO to the convergence. This later shown by the last ∼200 iterations in which the mean and variances are within the two-sigma levels. We notice that some parameters evolve (within the MCMC) in groups, which is related to their correlation.
Current usage metrics show cumulative count of Article Views (full-text article views including HTML views, PDF and ePub downloads, according to the available data) and Abstracts Views on Vision4Press platform.
Data correspond to usage on the plateform after 2015. The current usage metrics is available 48-96 hours after online publication and is updated daily on week days.
Initial download of the metrics may take a while.