Fig. A.3.
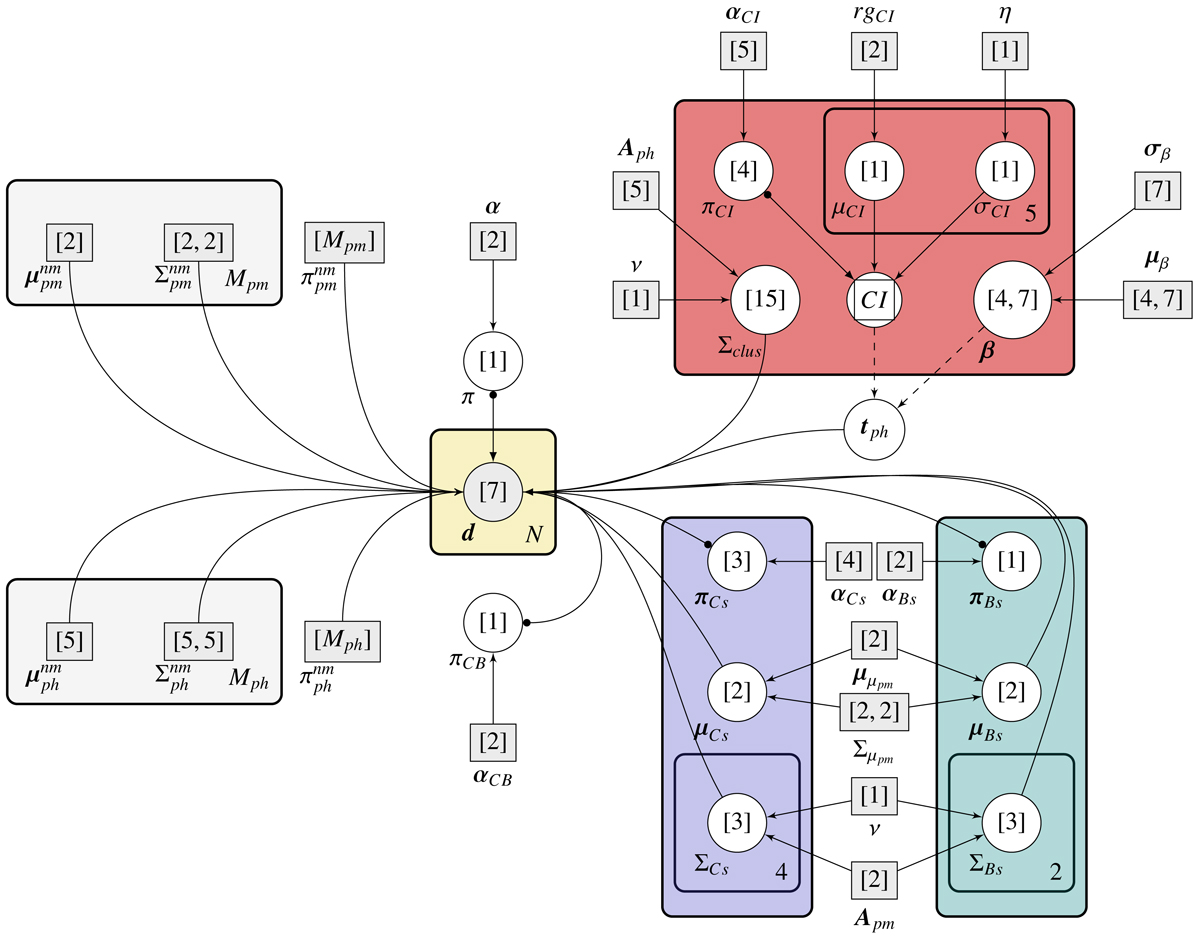
Probabilistic graphical model. The left grey plates show the field model. The middle yellow plate shows the node where the likelihood is computed for each datum, d. The right plates describe the relations among parameters in the cluster model. The photometric cluster model (red) is on top, while the proper motions cluster (blue) and equal-mass binaries (green) are at the bottom left and right, respectively. See description in the text for more details.
Current usage metrics show cumulative count of Article Views (full-text article views including HTML views, PDF and ePub downloads, according to the available data) and Abstracts Views on Vision4Press platform.
Data correspond to usage on the plateform after 2015. The current usage metrics is available 48-96 hours after online publication and is updated daily on week days.
Initial download of the metrics may take a while.