Open Access
Fig. A.2.
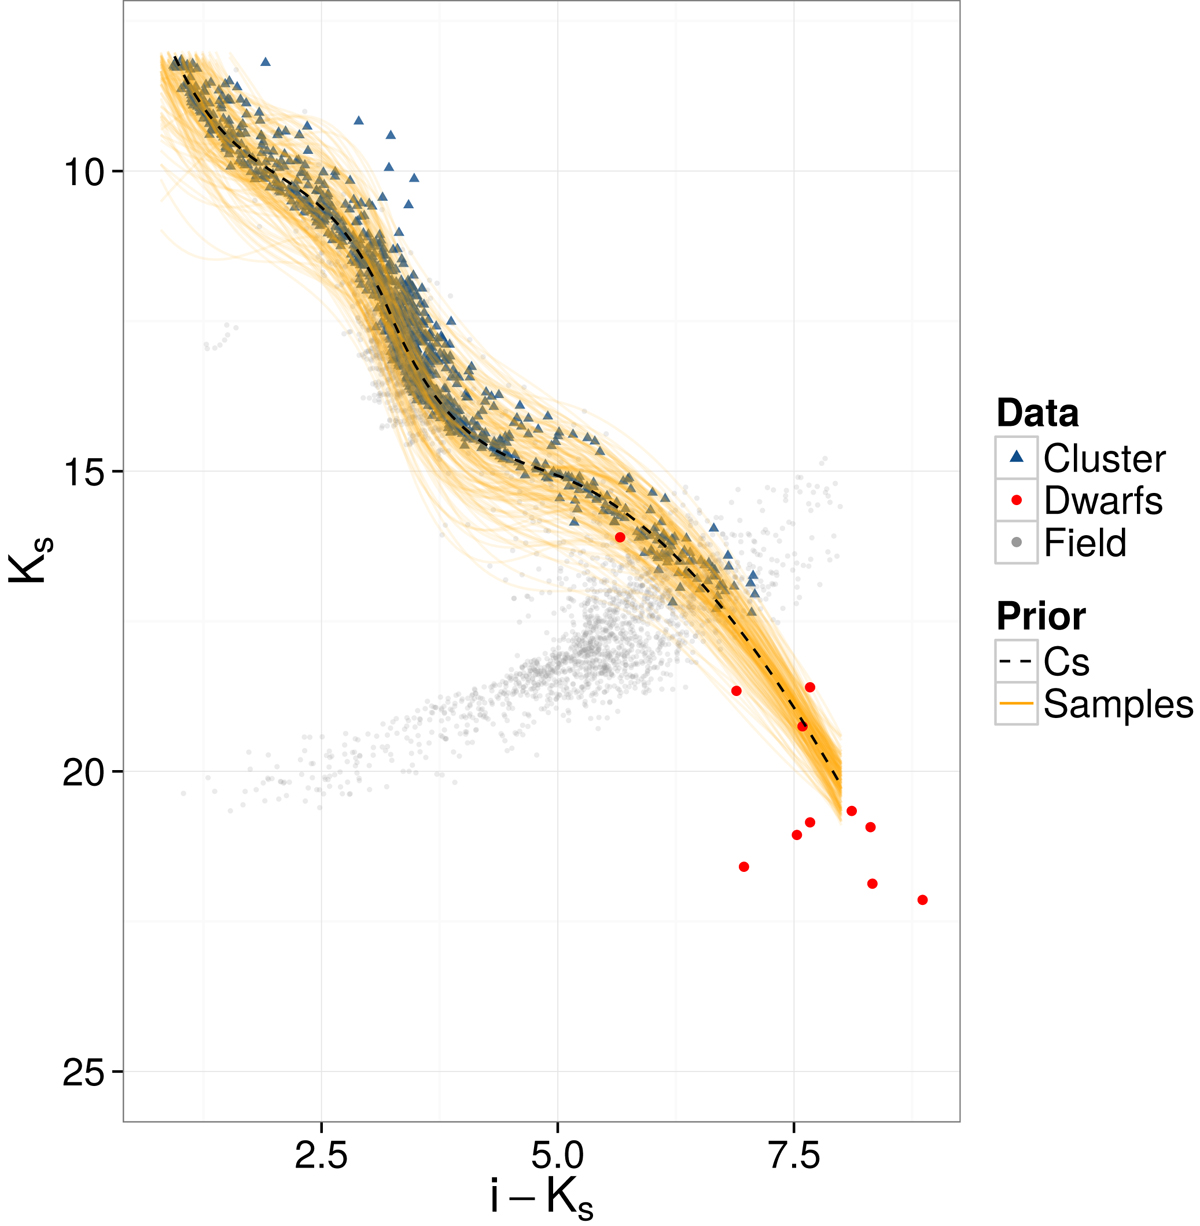
CMD Ks vs. i−Ks showing a sample of the prior for the coefficients in the splines series. Also shown the brown-dwarfs we add from Faherty et al. (2012) sample, and the cluster sequence (dashed line) found after fitting the splines to the brown-dwarfs and candidate members below the equal-mass binaries sequence.
Current usage metrics show cumulative count of Article Views (full-text article views including HTML views, PDF and ePub downloads, according to the available data) and Abstracts Views on Vision4Press platform.
Data correspond to usage on the plateform after 2015. The current usage metrics is available 48-96 hours after online publication and is updated daily on week days.
Initial download of the metrics may take a while.