| Issue |
A&A
Volume 616, August 2018
|
|
|---|---|---|
| Article Number | L14 | |
| Number of page(s) | 5 | |
| Section | Letters to the Editor | |
| DOI | https://doi.org/10.1051/0004-6361/201833823 | |
| Published online | 24 August 2018 | |
Letter to the Editor
Intense C III] λλ1907,1909 emission from a strong Lyman continuum emitting galaxy
1
Observatoire de Genève, Universitéde Genève, 51 Ch. des Maillettes, 1290 Versoix, Switzerland
e-mail: This email address is being protected from spambots. You need JavaScript enabled to view it.
2
CNRS, IRAP, 14 Avenue E. Belin, 31400 Toulouse, France
3
Bogolyubov Institute for Theoretical Physics, National Academy of Sciences of Ukraine, 14-b Metrolohichna str., Kyiv 03143, Ukraine
4
National Astronomical Observatory of Japan, 2-21-1 Osawa, Mitaka, Tokyo 181-8588, Japan
5
Institut für Physik und Astronomie, Universität Potsdam, Karl-Liebknecht-Str. 24/25, 14476 Potsdam, Germany
6
Astronomy Department, University of Virginia, PO Box 400325, Charlottesville, VA 22904-4325, USA
Received:
10
July
2018
Accepted:
31
July
2018
Abstract
We have obtained the first complete ultraviolet (UV) spectrum of a strong Lyman continuum (LyC) emitter at low redshift – the compact, low-metallicity, star-forming galaxy J1154+2443 – with a Lyman continuum escape fraction of 46% discovered recently. The Space Telescope Imaging Spectrograph spectrum shows strong Lyα and C III] λ1909 emission, as well as O III] λ1666. Our observations show that strong LyC emitters can have UV emission lines with a high equivalent width (e.g. EW(C III]) = 11.7 ± 2.9 Å rest-frame), although their equivalent widths should be reduced due to the loss of ionizing photons. The intrinsic ionizing photon production efficiency of J1154+2443 is high, log(ξ0ion = 25.56 erg−1 Hz), comparable to that of other recently discovered z ~ 0.3−0.4 LyC emitters. Combining our measurements and earlier determinations from the literature, we find a trend of increasing ξ0ion with increasing C III] λ1909 equivalent width, which can be understood by a combination of decreasing stellar population age and metallicity. Simple ionization and density-bounded photoionization models can explain the main observational features including the UV spectrum of J1154+2443.
Key words: galaxies: starburst / galaxies: high-redshift / dark ages, reionization, first stars / ultraviolet: galaxies
© ESO 2018
1. Introduction
To improve our understanding of galaxies, their ISM, and ionizing properties at high redshift, UV spectra play a fundamental role, especially as this domain is accessible to ground-based telescopes over a very wide redshift range, and observations of the most distant galaxies become feasible with the largest telescopes. Therefore both observational works and studies improving and applying the diagnostic power of rest-UV lines have flourished recently (see e.g. Stark et al. 2014, 2017; Le Fèvre et al. 2017; Maseda et al. 2017; Jaskot & Ravindranath 2016; Gutkin et al. 2016; Nakajima et al. 2018a).
At low redshift, there are relatively few UV observations of star-forming galaxies covering the spectral range of 1200–2000 Å, which includes for example Lyα, C IVλ1550, He IIλ1640, O III] λλ1660,1666 (hereafter O III] λ1666), C III] λλ1907,1909 (hereafter C III] λ1909) and other emission lines, although the need for comparison samples has recently been recognized (cf. Rigby et al. 2015; Berg et al. 2016; Senchyna et al. 2017). Despite this, only approximately 28 sources with C III] emission line detections from the HST are currently known from these studies. However, and most importantly, none of them is known as a Lyman continuum (LyC) emitter, and follow-up observations in the LyC are too time consuming for these z ≪ 0.3 sources.
Since Lyman continuum emitters are obviously fundamental to understand the sources of cosmic reionization, it is of prime interest to study such sources in terms of their physical properties, interstellar medium (ISM), stellar populations, and so on. Building on the recent success in identifying LyC emitters with HST at z ~ 0.3 (Leitherer et al. 2016; Izotov et al. 2016a, b, 2018a, b), we have targeted one of the strongest LyC leakers, the compact z = 0.369 galaxy J1154+2443 with a LyC escape fraction of 46% from Izotov et al. (2018a) to obtain the first complete HST UV spectrum of a strong LyC emitter.
2. The UV spectrum of a compact z = 0.369 LyC leaker with a high escape fraction
2.1. HST observations
The strong LyC emitter J1154+2443 was observed as part of mid-cycle observations in may 2018 (GO 15433, PI Schaerer). The observations were taken with the Space Telescope Imaging Spectrograph (STIS) NUV-MAMA using the grating G230L with the central wavelength 2376 Å and the slit 52″× 0″̣5 resulting in a spectral resolution R = 750. The acquisition was done using an image with the MIRVIS filter and an exposure of 360 s. The science exposure was 10 418 s obtained during four consecutive sub-exposures. Data reduction was done using the STIS pipeline. The individual sub-exposures with somewhat different spectral ranges were co-added using the IRAF dispcor routine, and the one-dimensional (1D) spectrum was extracted using IRAFs splot.
The observed STIS spectrum (Fig. 1) shows a clear detection of C III] λ1909, the presence of O III] λ1666, plus strong Lyα, which was previously observed by Izotov et al. (2018a). The measured line fluxes and equivalent widths are listed in Table 1. We note that with the chosen resolution, the C III] and O III] doublets are not resolved.
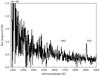 |
Fig. 1. STIS spectrum of J1154+2443 showing the detection of the O III] λ1666 and C III] λ1909 lines. |
Measurements from the STIS spectrum of J1154+2443.
2.2. Lyα emission
Compared to the UV spectrum obtained with the Cosmic Origins Spectrograph (COS) in a circular aperture of 2″̣5 diameter, the Lyα flux observed with the 0″̣5 slit of STIS is a factor 1.6 lower, whereas the UV continuum fluxes are compatible within the errors (cf. Izotov et al. 2018a). The total Lyα equivalent width, EW, of J1154+2443 determined from the COS data is EW(Lyα)=133 Å rest-frame. From the STIS 1D spectrum we find compact Lyα emission with an extension of 4.2 pix (0″̣1 FWHM), slightly larger than the UV continuum with a FHWM of 0″̣077.
2.3. The C/O abundance
The observed C III]/[O III] λλ4959,5007 line ratio and the O III] λ1666 equivalent width of J1154+2443 are comparable to other star-forming galaxies (cf. Berg et al. 2016, Senchyna et al. 2017). Compared to the latter sample, the EW(O III] λ1666) ~6 Å we find is at the upper end of the values measured by Senchyna et al. (2017) for their sample, which shows EW ~ 0.7−7 Å.
We derived the C/O abundance from the UV line ratio and the ratio of the UV to optical lines for the electron temperature and density derived in Izotov et al. (2018a). The UV line fluxes were corrected for Milky Way and internal attenuation, also following this latter paper. We obtain log(C/O) = −0.99 ± 0.16 using the C III] λ1909 and O III] λ1666 lines following Garnett et al. (1995), and log(C/O) = −0.84 ± 0.06 from the C III] and [O III] λλ4959,5007 line ratio (Izotov & Thuan 1999). We assumed an ionization correction factor ICF = 1.282 from Garnett et al. (1995). Other assumptions affecting the C/O abundances are discussed in Gutkin et al. (2016), for example. Both values are comparable to other C/O observations in H II regions and star-forming galaxies of similar metallicity (cf. Berg et al. 2016; Amorín et al. 2017).
2.4. Strong C III] λ1909 emission
The C III] λ1909 line of J1154+2443 has a high equivalent width, EW(C III]) = 11.7 ± 2.9 Å rest-frame, comparable to the strongest C III] emitters at low redshift with metallicities 12 + log(O/H) ~ 7.5−8, which are similar to that of J1154+2443 (12 + log(O/H) = 7.62−7.65, Izotov et al. 2018a), and also comparable to high-z galaxies as illustrated in Fig. 2. J1154+2443 agrees well with the proposed relation between the Lyα and C III] equivalent widths reported by Stark et al. (2014), and with measurements from larger samples, although the latter show a significant scatter between these observables (cf. Le Fèvre et al. 2017).
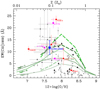 |
Fig. 2. C III] λ1909 rest-frame equivalent widths for low- and high-z star-forming galaxies with measured metallicities. The filled blue square shows J1154+2443 and the black filled triangles denote the low-redshift galaxies studied by Senchyna et al. (2017) and reanalysed by Chevallard et al. (2018). Red symbols show the z = 2−4 galaxies (stacked spectra) analysed by Nakajima et al. (2018a, b) and magenta symbols show the z = 1.844, 2.0, and 7.73 galaxies from Berg et al. (2018), Erb et al. (2010), and Stark et al. (2017), respectively. The smaller open triangles and filled diamonds represent the other low-z and z = 2−4 galaxies, respectively, compiled in Nakajima et al. (2018a). Green curves present photoionization models using single- (dotted) and binary- (long dashed) stellar populations with different ionization parameters (Nakajima et al. 2018a). |
As shown in Fig. 2, it is found empirically that the C III] equivalent width of star-forming galaxies increases with decreasing metallicity (cf. Rigby et al. 2015; Senchyna et al. 2017; Nakajima et al. 2018a). Since the C/O abundance ratio of J1154+2443 is “normal” for this metallicity we conclude that the C III] equivalent width can be compared to that of other sources at the same metallicity. Photoionization models approximately follow the observed trend, although they predict a non-monotonic behaviour with a maximum EW(C III]) at 12 + log(O/H) ≈ 7.8−8, and a decrease of the equivalent widths at lower metallicities as also shown in Fig. 2 (cf. Nakajima et al. 2018a). More data is needed to confirm the predicted decrease of EW(C III]) at very low metallicities.
The main result of these observations is probably the fact that the C III] λ1909 equivalent width is very high despite the fact that this galaxy has a very high escape fraction of Lyman continuum photons, with fesc = 0.46 ± 0.02 according to Izotov et al. (2018a). If a significant fraction of Lyman continuum photons escape the galaxy, the C III] equivalent width should be reduced. Indeed such a behaviour is predicted for high ionization parameters in the models of Jaskot & Ravindranath (2016), where it is seen that EW(C III]) decreases almost linearly with fesc for log U ≳ −2. Despite this, the EW of J1154+2443 is high; it is even among the highest observed. This shows that the C III] line cannot reliably be used to select strong Lyman continuum emitters, as proposed by Jaskot & Ravindranath (2016), who suggest that low C III] equivalent widths together with other emission lines, such as [O III] λλ4959,5007/[O II] λ3727, would indicate density bounded cases.
More quantitatively, we compare in Fig. 3 the observed [O III] λλ4959,5007/[O II] λ3727 ratio, a measure of the ionization parameter at known metallicity, and the C III] equivalent width to a grid of Cloudy H II region models for the metallicity of J1154+2443 and with varying degrees of Lyman continuum escape1. Compared to Fig. 2 we have assumed a higher electron density (Ne = 1000 cm−3), probably more appropriate for J1154+2443 (cf. Izotov et al. 2018a), although the uncertainty on Ne remains large. If correct, this leads to an increase of EW(C III]) by ~5−20%.
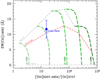 |
Fig. 3. Predicted C III] λ1909 rest-frame equivalent width as a function of [O III] λλ4959,5007/[O II] λ3727 for a gas-phase metallicity 12 + log(O/H) = 7.65 (~1/10 solar), electron density Ne = 1000 cm−3, varying ionization parameters log U = −3, −2.5, −2, −1.5, −1 (dashed colored lines from left to right) and escape fractions from zero (top) approaching unity (bottom). The models assume a BPASS SED for a population of 1 Myr, as in Fig. 2. The observations of J1154+2443 are well reproduced with a fairly high ionization parameter and with the observed escape fraction fesc = 46%. |
The observations are well reproduced by models with a high ionization parameter (log U ~ −2.5 to −2) and escape fractions fesc between 0 (ionization-bounded region) and ~50%, in agreement with the measured value of fesc. This comparison confirms that the EW of UV metal lines cannot be used to “single” out, i.e. recognise, this galaxy as a strong LyC emitter, and to determine its LyC escape fraction. More complex models will be needed in the future to account for geometrical constraints, such as the existence of ionized holes and regions with neutral gas covering the UV source, as found for LyC leakers by Gazagnes et al. (2018) and Chisholm et al. (2018).
Is the strength (EW) of other lines decreased due to a significant fraction of escaping ionizing photons? Starburst99 models predict EW(Hβ) consistently above 400 Å at ages up to 3–4 Myr, even higher up to 500 Å at low metallicities (Leitherer et al. 1999). The age of the UV-dominant population is constrained from optical continuum fits (cf. Izotov et al. 2018a) and from the UV lines (Schaerer et al., in prep.); it is of the order ~1−3 Myr. The rest EW(Hβ) = 160 Å of J1154+2443 is indeed significantly lower than these predictions, compatible with a reduced equivalent width due to LyC escape. On the other hand the EW of optical lines can also be reduced by the presence of an older underlying population, whose observational features may be difficult to find due to the strong emission lines and nebular continuum emission. In any case, Izotov et al. (2018a) obtained a consistent model accounting for the observed Hydrogen line strengths (fluxes and equivalent widths), an underlying population, and non-negligible LyC escape.
Zackrisson et al. (2013) proposed a method to identify galaxies with a high LyC escape fraction, by combining rest-frame UV slope and EW(Hβ) measurements to search for sources with reduced Hβ equivalent widths. Clearly this method is complicated in practice, since it requires the determination of the intrinsic UV slope, which depends on the a priori unknown amount of UV attenuation and the attenuation law – especially at high redshift (see e.g. Capak et al. 2015; Popping et al. 2017; Narayanan et al. 2018) – and is sensitive to several parameters including the metallicity, star-formation history, and age (Raiter et al. 2010; Binggeli et al. 2018). For J1154+2443 we find a UV slope β ~ −1.9 ± 0.3 from the STIS spectrum, considerably redder than the range of UV slopes predicted by Zackrisson et al. (2013), and which is clearly affected by dust attenuation, as shown by Izotov et al. (2018a). In short, we conclude that the method proposed by Zackrisson et al. (2013) is probably difficult to apply in practice to identify strong LyC leakers.
2.5. No strong He IIλ1640 emission
The He IIλ1640 line is not detected in the present spectrum of J1154+2443. Our non-detection corresponds to a line ratio of C III] λ1909/He IIλ1640 > 9.6 at 1σ, which, together with EW(C III]), places our source in the domain of star-forming galaxies (cf. Nakajima et al. 2018a), as expected. However, the observations are not particularly deep, providing only a relatively weak limit of EW(He IIλ1640) ≲ 3 Å. This does not exclude the presence of He II emission (either stellar or nebular) in this galaxy, with a strength comparable to that often seen in low-metallicity systems (Erb et al. 2010; Senchyna et al. 2017). In the available optical spectrum, He IIλ4686 is absent, with a relative intensity I(4686)/I(Hβ) ≲ 0.02 (Izotov et al. 2018a).
In any case, we note that similarly to J1154+2443, none of the 11 LyC leakers recently detected by our team show He IIλ4686 emission (with comparable limits on I(4686)/I(Hβ)), implying that the presence of a very hard ionizing spectrum is not a necessary criterion for LyC emission.
2.6. Ionizing photon production
The ionizing photon production of galaxies is one of the fundamental measures of importance for our understanding of cosmic reionization. This quantity, that is, the rate of hydrogen ionizing photons produced in a galaxy per unit time, is very often expressed in units of UV luminosity, and commonly denoted as ξion. As in Schaerer et al. (2016), we have derived ξion for the newly discovered LyC emitters of Izotov et al. (2018a, b), including J1154+2443, from the Balmer recombination lines, which directly count the ionizing photon rate and the COS UV spectra. Since some sources have a high LyC escape fraction we also correct for this effect. The bulk of the sources have  , higher than the canonical values of
  often adopted for high-z studies (e.g. Robertson et al. 2013). Here
  denotes ξion normalised to the intrinsic UV luminosity at 1500 Å rest-frame, after correction of dust attenuation. For J1154+2443, we obtain
  .
.
Determining the ionizing photon rate directly from UV spectral diagnostics would be very convenient, especially for high-redshift studies. For this purpose we plot  as a function of the C III] equivalent width in Fig. 4 (left). J1154+2443 has comparable
  and EW(C III]) to z ~ 2−4 C III] emitting galaxies observed in the VIMOS Ultradeep Survey (VUDS; cf. sample B from Nakajima et al. 2018a), faint narrow-band selected Lyα emitters at z = 3.1 (Nakajima et al. 2018b), the strong emission line galaxy of Berg et al. (2018), and to some low-z galaxies studied by Senchyna et al. (2017).
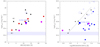 |
Fig. 4. Attenuation-corrected (i.e. intrinsic) ionizing photon production, |


Clearly a tendency of increasing  with increasing C III] λ1909 equivalent width is found (cf. also Chevallard et al. 2018). Such a trend is not unexpected as
  increases for young and metal-poor stellar populations (see e.g. Schaerer 2003; Raiter et al. 2010), which are conditions leading also to stronger C III] emission (cf. Jaskot & Ravindranath 2016; Nakajima et al. 2018a). On the other hand, the C III] line strength depends also on the C/O abundance ratio in the gas phase, which may vary from object to object, and the EW is predicted to decrease again for metallicities below (0.1−0.2) times solar, as shown by Nakajima et al. (2018a). This predicted “downturn” has not yet been seen clearly (cf. Fig 2). In any case, evolutionary synthesis models predict a maximum log(ξion) = 25.8 erg−1 Hz at the youngest ages and for low metallicities (Z ≳ 1/100 Z⊙); for PopIII this can go up to log(ξion) = 26.2 erg−1 Hz, depending on the stellar initial mass function (see Raiter et al. 2010).
Other indirect estimates of the ionizing photon production have been proposed, for example using the rest-frame EW of the optical [O III] λλ4959,5007 lines (Chevallard et al. 2018). Figure 4 (right) shows  as a function of EW([O III]) and the proposed correlation of these quantities from Chevallard et al. (2018). Although J1154+2443 is in agreement with this relation, the vast majority of the known low redshift LyC emitters, shown by the filled blue symbols, clearly do not follow this correlation, except if the ionizing photon production is normalised by the observed (not the intrinsic) UV luminosity (as shown by the dashed open circles). In any case the physical origin of such a correlation is more difficult to explain, especially since in general EWs of optical emission lines are subject to “dilution” from older stellar populations, that is, they are dependent on the past star-formation history.
3. Conclusion
We have obtained the first complete UV spectrum of a low-redshift galaxy with strong LyC emission, J1154+2443, which was recently discovered by Izotov et al. (2018a), and which shows a very high escape fraction of LyC radiation. This galaxy is a low-metallicity (12 + log(O/H) = 7.65), lowmass (log M⋆ ~ 8.2 M⊙), compact star-forming galaxy, which had been selected for its very high ratio of the optical lines [O III] λ5007/[O II] λ3727 = 11.5. The observations with STIS on board HST, covering the spectral range ~1200−2200 Å restframe, show strong Ly and C III] λ1909 emission, as well as the presence of O III] λ1666.
We find a C/O abundance of log(C/O) ~ −0.9; that is, low, but comparable to other C/O measurements at low metallicity. J1154+2443 shows a very strong C III] λ1909 emission line with an equivalent width EW(C III]) = 11.7 ± 2.9 Å, comparable to some other low-redshift sources of similarly low metallicity (see Fig. 2). The high EW(C III]) shows that strong LyC emitters do not necessarily have weak C III] emission, as predicted by some models (cf. Jaskot & Ravindranath 2016). Simple photoionization models can explain the main observational features and the UV spectrum of J1154+2443, but are not able distinguish between no LyC escape and the observed fesc= 46%.
The intrinsic ionizing photon production efficiency of J1154+2443 is  , comparable to that of the other recently discovered z ~ 0.3−0.4 LyC emitters (see Schaerer et al. 2016), and higher than the canonical value for
  by a factor of approximately two (cf. Robertson et al. 2013). With other data from the literature, we find a trend of increasing
  with increasing C III] λ1909 equivalent width (Fig. 4 left), which can be understood by a combination of decreasing stellar population age and metallicity. If confirmed with larger samples, such a relation would be useful for studies of high-z galaxies, which rely on rest-UV spectra. The majority of the z ~ 0.3−0.4 leakers discovered with HST/COS observations do not follow the correlation between
  and EW([O III] λλ4959,5007) proposed by Chevallard et al. (2018).
The models are an extension of those described in detail by Nakajima et al. (2018a), with varying escape fractions computed as in Nakajima & Ouchi (2014).
Acknowledgments
DS wishes to dedicate this publication to the memory of Nolan Walborn, passed away in february 2018, who was an exceptional spectroscopist, inspiring colleague, and a very humorous and open-minded person. We thank Danielle Berg for communications on low-redshift galaxy samples. This work is based on HST mid-cycle observations (GO 15433, PI Schaerer), for which we thank the HST staff for their help. Y.I. acknowledges support from the National Academy of Sciences of Ukraine (Project No. 0116U003191) and by its Program of Fundamental Research of the Department of Physics and Astronomy (Project No. 0117U000240). K.N. acknowledges a JSPS Research Fellowship for Young Scientists, A.V. funding from the ERC-stg-757258 grant TRIPLE, and T.X.T. support from grant HST-GO-15433.002-A.
References
- Amorín, R., Fontana, A., Pérez-Montero, E., et al. 2017, Nat. Astron., 1, 0052 [NASA ADS] [CrossRef] [Google Scholar]
- Berg, D. A., Skillman, E. D., Henry, R. B. C., Erb, D. K., & Carigi, L. 2016, ApJ, 827, 126 [NASA ADS] [CrossRef] [Google Scholar]
- Berg, D. A., Erb, D. K., Auger, M. W., Pettini, M., & Brammer, G. B. 2018, ApJ, 859, 164 [NASA ADS] [CrossRef] [Google Scholar]
- Binggeli, C., Zackrisson, E., Pelckmans, K., et al. 2018, MNRAS, 479, 368 [NASA ADS] [Google Scholar]
- Capak, P. L., Carilli, C., Jones, G., et al. 2015, Nature, 522, 455 [NASA ADS] [CrossRef] [Google Scholar]
- Chevallard, J., Charlot, S., Senchyna, P., et al. 2018, MNRAS, 479, 3264 [NASA ADS] [CrossRef] [Google Scholar]
- Chisholm, J., Gazagnes, S., & Schaerer, D. 2018, A&A, 616, A30 [NASA ADS] [CrossRef] [EDP Sciences] [Google Scholar]
- Erb, D. K., Pettini, M., Shapley, A. E., et al. 2010, ApJ, 719, 1168 [NASA ADS] [CrossRef] [Google Scholar]
- Garnett, D. R., Skillman, E. D., Dufour, R. J., et al. 1995, ApJ, 443, 64 [NASA ADS] [CrossRef] [Google Scholar]
- Gazagnes, S., Chisholm, J., Schaerer, D. 2018, A&A, 616, A29 [NASA ADS] [CrossRef] [EDP Sciences] [Google Scholar]
- Gutkin, J., Charlot, S., & Bruzual, G. 2016, MNRAS, 462, 1757 [NASA ADS] [CrossRef] [Google Scholar]
- Izotov, Y. I., & Thuan, T. X. 1999, ApJ, 511, 639 [NASA ADS] [CrossRef] [Google Scholar]
- Izotov, Y. I., Orlitová, I., Schaerer, D., et al. 2016a, Nature, 529, 178 [NASA ADS] [CrossRef] [Google Scholar]
- Izotov, Y. I., Schaerer, D., Thuan, T. X., et al. 2016b, MNRAS, 461, 3683 [NASA ADS] [CrossRef] [Google Scholar]
- Izotov, Y. I., Schaerer, D., Worseck, G., et al. 2018a, MNRAS, 474, 4514 [NASA ADS] [CrossRef] [Google Scholar]
- Izotov, Y. I., Worseck, G., Schaerer, D., et al. 2018b, MNRAS, 478, 4851 [NASA ADS] [CrossRef] [Google Scholar]
- Jaskot, A. E., & Ravindranath, S. 2016, ApJ, 833, 136 [NASA ADS] [CrossRef] [Google Scholar]
- Le Fèvre, O., Lemaux„ B., & Nakajima, K. 2017, A&A, submitted [arXiv:1710.10715] [Google Scholar]
- Leitherer, C., Schaerer, D., Goldader, J. D., et al. 1999, ApJS, 123, 3 [NASA ADS] [CrossRef] [Google Scholar]
- Leitherer, C., Hernandez, S., Lee, J. C., & Oey, M. S. 2016, ApJ, 823, 64 [NASA ADS] [CrossRef] [Google Scholar]
- Maseda, M. V., Brinchmann, J., Franx, M., et al. 2017, A&A, 608, A4 [NASA ADS] [CrossRef] [EDP Sciences] [Google Scholar]
- Nakajima, K., & Ouchi, M. 2014, MNRAS, 442, 900 [NASA ADS] [CrossRef] [Google Scholar]
- Nakajima, K., Schaerer, D., Le Fèvre, O., et al. 2018a, A&A, 612, A94 [NASA ADS] [CrossRef] [EDP Sciences] [Google Scholar]
- Nakajima, K., Fletcher, T., Ellis, R. S., Robertson, B. E., & Iwata, I. 2018b, MNRAS, 477, 2098 [NASA ADS] [CrossRef] [Google Scholar]
- Narayanan, D., Davé, R., Johnson, B. D., et al. 2018, MNRAS, 474, 1718 [NASA ADS] [CrossRef] [Google Scholar]
- Popping, G., Puglisi, A., & Norman, C. A. 2017, MNRAS, 472, 2315 [NASA ADS] [CrossRef] [Google Scholar]
- Raiter, A., Schaerer, D., & Fosbury, R. A. E. 2010, A&A, 523, A64 [NASA ADS] [CrossRef] [EDP Sciences] [Google Scholar]
- Rigby, J. R., Bayliss, M. B., Gladders, M. D., et al. 2015, ApJ, 814, L6 [NASA ADS] [CrossRef] [Google Scholar]
- Robertson, B. E., Furlanetto, S. R., Schneider, E., et al. 2013, ApJ, 768, 71 [NASA ADS] [CrossRef] [Google Scholar]
- Schaerer, D. 2003, A&A, 397, 527 [NASA ADS] [CrossRef] [EDP Sciences] [Google Scholar]
- Schaerer, D., Izotov, Y. I., Verhamme, A., et al. 2016, A&A, 591, L8 [NASA ADS] [CrossRef] [EDP Sciences] [Google Scholar]
- Senchyna, P., Stark, D. P., Vidal-García, A., et al. 2017, MNRAS, 472, 2608 [NASA ADS] [CrossRef] [Google Scholar]
- Stark, D. P., Richard, J., Siana, B., et al. 2014, MNRAS, 445, 3200 [NASA ADS] [CrossRef] [Google Scholar]
- Stark, D. P., Ellis, R. S., Charlot, S., et al. 2017, MNRAS, 464, 469 [NASA ADS] [CrossRef] [Google Scholar]
- Zackrisson, E., Inoue, A. K., & Jensen, H. 2013, ApJ, 777, 39 [NASA ADS] [CrossRef] [Google Scholar]
All Tables
All Figures
|
Fig. 1. STIS spectrum of J1154+2443 showing the detection of the O III] λ1666 and C III] λ1909 lines. |
| In the text | |
|
Fig. 2. C III] λ1909 rest-frame equivalent widths for low- and high-z star-forming galaxies with measured metallicities. The filled blue square shows J1154+2443 and the black filled triangles denote the low-redshift galaxies studied by Senchyna et al. (2017) and reanalysed by Chevallard et al. (2018). Red symbols show the z = 2−4 galaxies (stacked spectra) analysed by Nakajima et al. (2018a, b) and magenta symbols show the z = 1.844, 2.0, and 7.73 galaxies from Berg et al. (2018), Erb et al. (2010), and Stark et al. (2017), respectively. The smaller open triangles and filled diamonds represent the other low-z and z = 2−4 galaxies, respectively, compiled in Nakajima et al. (2018a). Green curves present photoionization models using single- (dotted) and binary- (long dashed) stellar populations with different ionization parameters (Nakajima et al. 2018a). |
| In the text | |
|
Fig. 3. Predicted C III] λ1909 rest-frame equivalent width as a function of [O III] λλ4959,5007/[O II] λ3727 for a gas-phase metallicity 12 + log(O/H) = 7.65 (~1/10 solar), electron density Ne = 1000 cm−3, varying ionization parameters log U = −3, −2.5, −2, −1.5, −1 (dashed colored lines from left to right) and escape fractions from zero (top) approaching unity (bottom). The models assume a BPASS SED for a population of 1 Myr, as in Fig. 2. The observations of J1154+2443 are well reproduced with a fairly high ionization parameter and with the observed escape fraction fesc = 46%. |
| In the text | |
|
Fig. 4. Attenuation-corrected (i.e. intrinsic) ionizing photon production, |
| In the text | |
Current usage metrics show cumulative count of Article Views (full-text article views including HTML views, PDF and ePub downloads, according to the available data) and Abstracts Views on Vision4Press platform.
Data correspond to usage on the plateform after 2015. The current usage metrics is available 48-96 hours after online publication and is updated daily on week days.
Initial download of the metrics may take a while.