Fig. 4.
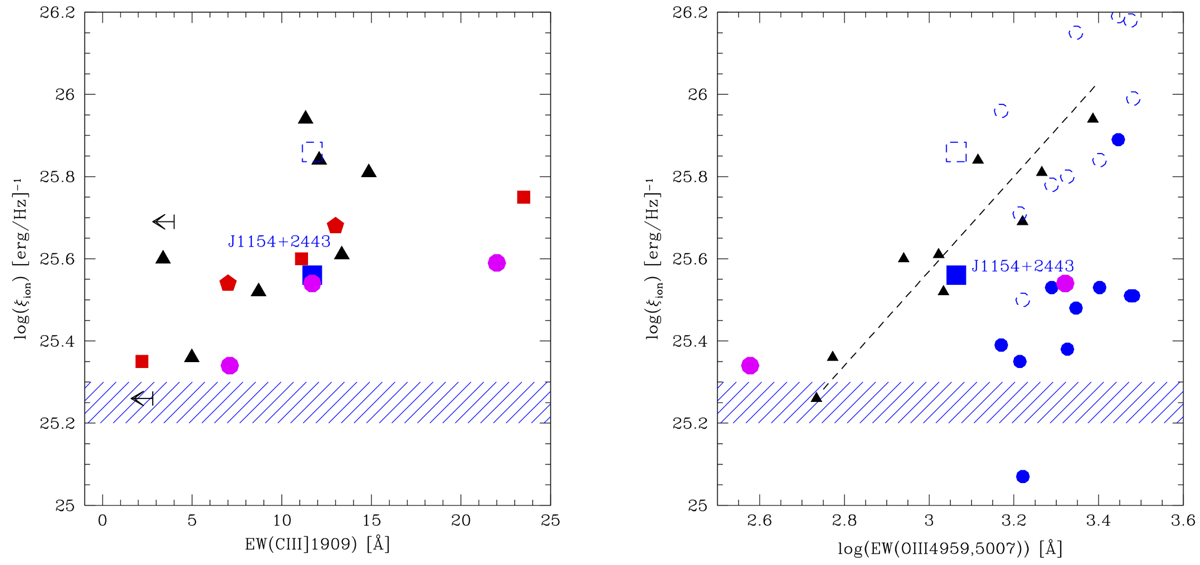
Attenuation-corrected (i.e. intrinsic) ionizing photon production, ![]() , as a function of the C III] λ1909 equivalent width (left panel) and the [O III] λλ4959,5007 EW (right). J1154+2443 is shown by the filled blue square; other LyC leakers as filled blue circles. Open symbols show ξion with no attenuation correction for the UV luminosity. Comparison samples are plotted using the same symbols as in Fig. 2. The blue shaded area denotes the range of
, as a function of the C III] λ1909 equivalent width (left panel) and the [O III] λλ4959,5007 EW (right). J1154+2443 is shown by the filled blue square; other LyC leakers as filled blue circles. Open symbols show ξion with no attenuation correction for the UV luminosity. Comparison samples are plotted using the same symbols as in Fig. 2. The blue shaded area denotes the range of ![]() often assumed as the “standard” value, obtained for constant star formation over a long timescale and subsolar metallicities (cf. Robertson et al. 2013).
often assumed as the “standard” value, obtained for constant star formation over a long timescale and subsolar metallicities (cf. Robertson et al. 2013).
Current usage metrics show cumulative count of Article Views (full-text article views including HTML views, PDF and ePub downloads, according to the available data) and Abstracts Views on Vision4Press platform.
Data correspond to usage on the plateform after 2015. The current usage metrics is available 48-96 hours after online publication and is updated daily on week days.
Initial download of the metrics may take a while.