| Issue |
A&A
Volume 616, August 2018
|
|
|---|---|---|
| Article Number | L5 | |
| Number of page(s) | 6 | |
| Section | Letters to the Editor | |
| DOI | https://doi.org/10.1051/0004-6361/201833766 | |
| Published online | 15 August 2018 | |
Letter to the Editor
First detection of H2S in a protoplanetary disk
The dense GG Tauri A ring
1
Laboratoire d’Astrophysique de Bordeaux, Université de Bordeaux, CNRS, B18N, Allée Geoffroy Saint-Hilaire, 33615 Pessac, France
e-mail: thi-phuong.nguyen@u-bordeaux.fr
2
Department of Astrophysics, Vietnam National Space Center, Vietnam Academy of Science and Techonology, 18 Hoang Quoc Viet, Cau Giay, Hanoi, Vietnam
3
Graduate University of Science and Technology, Vietnam Academy of Science and Techonology, 18 Hoang Quoc Viet, Cau Giay, Hanoi, Vietnam
4
IRAM, 300 rue de la piscine, 38406 Saint Martin d’Hères Cedex, France
5
Jet Propulsion Laboratory, California Institute of Technology, 4800 Oak Grove Drive, Pasadena, CA 91109, USA
6
Academia Sinica Institute of Astronomy and Astrophysics, PO Box 23-141, Taipei 106, Taiwan
7
Space Telescope Science Institute, 3700 San Martin Drive, Baltimore, MD 21218, USA
8
Department of Physics and Astronomy, Colgate University, 13 Oak Drive, Hamilton, NY 13346, USA
Received:
3
July
2018
Accepted:
27
July
2018
Context. Studying molecular species in protoplanetary disks is very useful to characterize the properties of these objects, which are the site of planet formation.
Aims. We attempt to constrain the chemistry of S-bearing molecules in the cold parts of circumstellar disk of GG Tau A.
Methods. We searched for H2S, CS, SO, and SO2 in the dense disk around GG Tau A with the NOrthem Extended Millimeter Array (NOEMA) interferometer. We analyzed our data using the radiative transfer code DiskFit and the three-phase chemical model Nautilus.
Results. We detected H2S emission from the dense and cold ring orbiting around GG Tau A. This is the first detection of H2S in a protoplanetary disk. We also detected HCO+, H13CO+, and DCO+ in the disk. Upper limits for other molecules, CCS, SO2, SO, HC3N, and c-C3H2 are also obtained. The observed DCO+/HCO+ ratio is similar to those in other disks. The observed column densities, derived using our radiative transfer code DiskFit, are then compared with those from our chemical code Nautilus. The column densities are in reasonable agreement for DCO+, CS, CCS, and SO2. For H2S and SO, our predicted vertical integrated column densities are more than a factor of 10 higher than the measured values.
Conclusions. Our results reinforce the hypothesis that only a strong sulfur depletion may explain the low observed H2S column density in the disk. The H2S detection in GG Tau A is most likely linked to the much larger mass of this disk compared to that in other T Tauri systems.
Key words: protoplanetary disks / molecular data / astrochemistry / stars: individual: GG Tau
© ESO 2018
1. Introduction
Understanding the physical and chemical structure of protoplanetary disks is needed to determine the initial conditions of planet formation. Studies of protoplanetary disks have led to a global picture in which disks are flared and layered with important vertical, radial density, and temperature gradients. The uppermost layer is directly illuminated by stellar UV and dominated by photodissociation reactions, while molecules stick to dust grains in the very cold midplane. In between there is a rich molecular layer (Kenyon & Hartmann 1987; van Zadelhoff et al. 2001). Studies of the gas content rely on trace molecules because H2 is not detectable at the temperatures of disks. So far, the molecules that have been detected in T Tauri disks are CO, 13CO, C18O, C17O, CN, CS, H2CO, CCH, DCN, HCO+, H13CO+, DCO+, N2H+, HC3N, CH3CN, HD, C3H2, C2H2, OH, SO, CH+, N2D+, NH3, CH3OH, H13CN, HC15N, C15N, and HCOOH (Dutrey et al. 1997, 2011; Thi et al. 2001; Qi et al. 2008, 2013; Chapillon et al. 2012; Bergin et al. 2013; Huang & Öberg 2015; Öberg et al. 2015; Walsh et al. 2016; Guilloteau et al. 2016; Salinas et al. 2016; Guzmán et al. 2015; Hily-Blant et al. 2017; Favre et al. 2018).
More than a dozen S-bearing species have been observed in dense cloud cores; they are chemically active and often used as chemical clocks in low-mass star forming regions (Buckle & Fuller 2003; Wakelam et al. 2004a, b). Some S-bearing species, CS, SO, SO2, and H2S, are observed in Class 0 and Class I sources (Dutrey et al. 2011; Guilloteau et al. 2013, 2016) while CS, the second main reservoir of sulfur in the gas phase (Vidal et al. 2017) is the only S-bearing molecule detected in disks around T Tauri stars.
We report the first detection of H2S in a disk around a T Tauri star, GG Tau A. GG Tau, located at 150 pc in Taurus-Auriga star forming region (Gaia Collaboration 2016, 2018), is a hierarchical quintuple system with the GG Tau A triple star (separation ~5 and 38 au; Di Folco et al. 2014) surrounded by a dense ring located between 180 and 260 au and a large disk extending out to 800 au (see Dutrey et al. 2016; and references therein). The disk is massive (0.15 M⊙) and cold; it has a dust temperature of 14 K at 200 au, a kinetic temperature derived from CO analysis of ~20 K at the same radius (Dutrey et al. 2014; Guilloteau et al. 1999), and little or no vertical temperature gradient in the molecular layer (Tang et al. 2016). The large size, low temperature, and large mass make GG Tau A disk an ideal laboratory to search for cold molecular chemistry.
Besides the H2S detection, we also report detections of HCO+, DCO+, and H13CO+ and discuss the upper limits of CCS, SO2, SO, c-C3H2, and HC3N.
2. Observations and results
2.1. Observations
The H2S 1(1,0)–1(0,1) observations were carried out with the NOrthem Extended Millimeter Array (NOEMA) on 23, December 2017 using D configuration with nine antennas. The total on source integration time is 5.2 h. Baselines ranging between 24 m and 176 m provide an angular resolution of 2.50″ × 1.9″, PA = 15°. Phase and amplitude calibrations were performed using 0507+179 and 0446+112. Flux calibration was carried out using MWC349 as a reference (flux 1.6 Jy at 170.3 GHz). The full 7.74 GHz upper and lower sidebands of the new PolyFiX correlator were covered at 2 MHz channel spacing, and high spectral resolution (62.5 kHz) windows covered lines of H2S 1(1,0)–1(0,1), H13CO+ (2–1), CCS, SO2, SO, HC3N, and c-C3H2.
DCO+ (3–2) was observed with PdBI interferometer (now known as NOEMA) in December 2013 and April 2014 with six antennas at an angular resolution of 1.76″ × 1.23″, PA = 17°. Phase and amplitude calibrations were performed using 0507+179 and 0446+112, while the flux calibration was carried out using 3C84 and MWC 349.
The HCO+(1–0) data are from Guilloteau et al. (1999) and are processed in this work with a resolution of 4.57″ × 2.55″, at PA = −38°. We used the GILDAS1 software package to reduce the data. Images were produced using natural weighting and Hogbom algorithm. The continuum emission is subtracted from the line maps.
2.2. Results
Figure 1 shows integrated intensity maps (upper panels) and velocity maps (lower panels) of the detected lines, H2S 1(1,0)–1(0,1), H13CO+ (2–1), DCO+(3–2), and HCO+(1–0). The velocity maps show a clear signature of Keplerian rotation. Channel maps are presented in Appendix A.
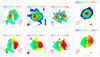 |
Fig. 1. Upper row: integrated intensity maps. The color scale is in the unit of (Jy beam−1 km s−1). Contour level step is 2σ. Lower row: velocity maps. Contour level step is 0.5 km s−1. Beam sizes are indicated. The ellipses show the location of inner (~180 au) and outer (~260 au) radii of the dust ring. |
H2S 1(1, 0)−1(0, 1) is clearly detected with a peak S/N ≳ 4 in several channels. Most of the line emission originates from the dense ring between 180 and 260 au and extends up to ≲500 au. The weak east-west asymmetry is unlikely to be significant given the limited signal-to-noise ratio (S/N).
HCO+(1–0) and H13CO+(2–1) are detected with high S/N(≥7). HCO+(1–0) is as extended as the CO emission out to ~800 au (Guilloteau et al. 1999). The optically thin emission from the J = 2–1 line of the H13CO+ isotopolog peaks on the dense ring and extends to ~500 au. On the contrary, the DCO+(3–2) emission, detected at S/N ≥ 7, peaks just outside of the dense ring, near 280 au, suggesting radially varying deuteration. Other sulfur-bearing species, SO, SO2, CCS, and carbon-bearing species HC3N and c-C3H2, are not detected.
3. Data analysis
3.1. DiskFit modeling
We assume the physical parameters that govern line emission to vary as power laws of the radii (Dutrey et al. 1994; Piétu et al. 2007). The data were analyzed inside the uv plane using the radiative transfer code DiskFit, which uses χ2 minimization technique, comparing the observed visibilities to visibilities predicted by ray tracing (Piétu et al. 2007).
The source parameters such as geometry (inclination, orientation, and systemic velocity), velocity, and temperature power laws are kept constant as they are well known from previous studies (Dutrey et al. 1994, 2014; Guilloteau et al. 1999 and our Table 1). Only the molecule surface density parameter Σ250 was varied during the minimization process. Results are presented in Table 2 with 3σ upper limits for undetected molecules.
GG Tau parameters.
Observed and predicted surface densities (cm−2).
3.2. Nautilus modeling
To model the chemistry in the dense and cold ring of GG Tau A, we used the gas-grain chemical model Nautilus (Ruaud et al. 2016). This model simulates chemistry in three phases, i.e., gas phase, grain surface, and grain mantle, along with possible exchanges between the different phases. The reference chemical network is deuspin.kida.uva.2016 (Majumdar et al. 2017) with the updates in sulfur chemistry from Vidal et al. (2017). The disk structure is similar to that used in Wakelam et al. (2016). In addition to disk parameters from Table 1, we assume a stellar UV flux of fUV200AU = 375 χ0 at 200 au, where χ0 is in the units of the Draine (1978) interstellar UV field, based on what is observed in T Tauri stars (Bergin et al. 2004). Based on the observation (Tang et al. 2016), we introduced a small vertical temperature gradient with Tk = 30 K at three scale heights.
To compute the chemistry, we first calculated the chemical composition of the gas and ices of the parent cloud, assuming conditions for a dense cloud with an age of ~106 yr and then ran the model for another 106 yr (Wakelam et al. 2016). For the parent cloud, initially all the elements are in atomic form (see Table 1, Vidal et al. 2017) except for hydrogen and deuterium, which are initially in H2 and HD forms, respectively (Majumdar et al. 2017).
We present the trends of the chemistry inside the ring at a radius of 250 au in order to explain the observed column densities of H2S, CS, DCO+, and HCO+. We explored various initial C/O ratios, ortho to para ratios for H2 (OPR), initial sulfur abundances X(S), grain sizes, and UV flux. According to Bergin et al. (2016), CCH emission can only be explained with a gas-phase C/O ratio larger than 1. This represents a scenario in which oxygen is depleted on the grains before the formation of the disk and driven to the midplane of the disk. In other words, oxygen would not participate in the chemistry in the region where they observe CCH. Semenov et al. (2018) found that the column densities of SO and SO2 drop by factors of ~100 and 500, respectively, when C/O changes from 0.46 to 1.2, whereas column densities of H2S do not change as the species contains neither C nor O. We stick to the standard C/O ratio of 0.7 in our model (Hincelin et al. 2011; Wakelam et al. 2016; Majumdar et al. 2017), which gives a reasonably good agreement for DCO+, CS, CCS, HC3N, and SO2.
Results are therefore presented for C/O = 0.7, OPR = 3, X(S) = 8 × 10⁻⁸ and a grain size of 0.1 μm. Other models lead to larger disagreement with the data. Figure 2 and Appendix B show the predicted vertical distribution of the molecules, and Table 2 compares the predicted surface densities to the observational results derived using DiskFit.
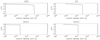 |
Fig. 2. Best model of H2S, CS, DCO+, and HCO+ in the GG Tau A ring derived from Nautilus. The surface density is shown vs. the z/H ratio (z/H=1 means 1 scale height). |
4. Discussion
4.1. Comparison with other sources
The measured H2S column density is a factor of three greater than the upper limits quoted by Dutrey et al. (2011) for DM Tau, LkCa 15, MWC 480, and GO Tau, probably reflecting the larger disk mass of GG Tau A. However, the CS to H2S abundance ratio of ~20 in GG Tau A may still be similar in all sources. The upper limit on HC3N is about two times lower than the detections reported in LkCa 15, MWC 480, and GO Tau by Chapillon et al. (2012).
To make relevant abundances comparisons, we use 13CO as a reference since H2 column densities are difficult to accurately determine. The results for the disks of GG Tau A and LkCa15 and the dark cloud TMC-1 are given in Table 3. LkCa15 is a T Tauri star similar to GG Tau A: its disk exhibits a central cavity of radius 50 au (Piétu et al. 2006) and has a mass on the order of ~0.028 M⊙ (Guilloteau et al. 2011). Determining the uncertainties is difficult because the abundances were obtained from different studies. Therefore, we assume errors of 30% in the cases of LkCa 15 and TMC-1.
Molecular abundance relative to 13CO (X[mol]/X[13CO] × 105).
For GG Tau A, we take a 13CO column density, derived from observations, at 250 au of Σ250 = 1.13 × 1016 cm−2 (Phuong et al., in prep). For LkCa 15, Punzi et al. (2015) found HCO+ abundance relative to 13CO of 15 × 10−4, Huang et al. (2017) gave abundance ratios of DCO+/HCO+ and DCO+/H13CO+ of 0.024 and 1.1, respectively, and Dutrey et al. (2011) gave an upper limit of H2S relative to CO of 10−6, which we convert to 13CO using an isotopic ratio 12C/13C ~60 (Lucas & Liszt 1998).
In the TMC-1 dark cloud, Ohishi et al. (1992) determined 12CO abundance relative to H2 of 8 × 10⁻⁵ or 1.3 × 10⁻⁶ for 13CO. The abundance relative to H2 of HCO+, H2S (upper limit; Omont 2007), H13CO+, and DCO+ (Butner et al. 1995) are then used to get the abundances relative to 13CO. In L134N, the abundances of these species are similar, but H2S has been detected with an abundance ratio of 60 × 10−5 (Ohishi et al. 1992), similar to the upper limit obtained in TMC-1. Thus, the disks appear to have very similar relative abundances, suggesting similar chemical processes at play, while the dense core differs significantly.
4.2. Sulfur-bearing species
In the chemical modeling, we found that H2S peaks around three scale heights. The main reason behind this is rapid formation of H2S on the grain surface via the hydrogenation reaction of HS, i.e., grain-H + grain-HS → grain-H2S. Once H2S is formed on the surface, it is then chemically desorbed to the gas phase. Almost 80% of the H2S comes from the surface reactions, whereas the contribution of the gas-phase reaction H3S++e− → H + H2S is about 20%. Below three scale heights, H2S depletes rapidly on the grains because of the increase in density and decrease in temperature. At the same altitude, CS is formed in the gas phase via the dissociative recombination reactions of HCS+, H2CS+, H3CS+, and HOCS+.
The modeled CCS and SO2 column densities (shown in Table 2 and in Appendix B) are low, explaining their non-detection but the SO column density is overpredicted. The CCS molecule shows its peak above z/H = 3 and is due to the gas phase formation via S + CCH → H + CCS and HC2S+ + e− → H + CCS reactions. SO2 is made from the OH + SO reaction around this location, whereas SO comes from the S + OH reaction.
We found that the UV field has a negligible impact on the H2S desorption and mildly affects the SO/H2S ratio. The key parameter in the model is the initial S abundance. Even with the low value, 8 × 10⁻⁸, the chemical model overpredicts H2S and SO by about an order of magnitude, but is compatible with CS and the current limits on SO2 and CCS.
In our models, the molecular layer is very thin and situated high above the disk plane at three scale heights. This is at odds with the observations of CS in the Flying Saucer (Dutrey et al. 2017), where CS appears closer to one scale height. The difference may be due to the larger mass of the GG Tau disk (0.15 M⊙). On one side, the high densities limit the UV radiation penetration (which drives the active chemistry) to the uppermost layers, while closer to the midplane, the even higher densities lead to more efficient depletion on dust grains.
Our results suggest that chemistry for H2S on the grain surfaces is likely not properly taken into account even with our three-phase model and that a significant amount of H2S should change in some more complex sulfur-bearing species, limiting the overall desorption of S-bearing molecules (Dutrey et al. 2011; Wakelam et al. 2005). Indeed, measurements of S-bearing species in comets 67P performed by ROSETTA indicate a solar value for the S/O elemental ratio within 2σ errors (Calmonte et al. 2016). H2S accounts for about half of the S budget in the comet, suggesting that transformation of H2S to other compounds in ices is limited. The nearly constant H2S/H2O ratio also suggests that H2S does not evaporate alone, but in combination with water (Jiménez-Escobar & Muñoz Caro 2011).
4.3. Chemistry of DCO+ and other observed species
Chemistry of DCO+. The measured HCO+/H13CO+ ratio is about 30, suggesting partially optically thick emission for HCO+(1−0) line. The measured DCO+/HCO+ ratio, ~0.03 over the disk, is comparable to the averaged value (~0.04; van Dishoeck et al. 2003) derived in the disk of TW Hydra of mass of ~0.06 M⊙ (Bergin et al. 2013), and in the disk of LkCa 15 (ratio of ~0.024, Huang et al. 2017.) This shows clear evidence of ongoing deuterium enrichment.
HCO+ formation and deuteration is controlled by CO as well as H2D+ and  ions. These ions are mostly sensitive to the X-ray flux, while UV radiation and cosmic rays play a limited role, and their balance is controlled by the temperature sensitive reaction
  . Because of the temperature dependences, DCO+ is expected to be enhanced around the CO snow-line, as illustrated by the ring structure in HD 163296 (Mathews et al. 2013). Our model somewhat underpredicts the HCO+ content. At 250 au, HCO+ peaks at three scale heights, where the molecular layer is warm (~30 K) and forms mainly from the reaction of CO + ortho-H3+. At this altitude, DCO+ forms from the isotope exchange reaction between HCO+ and D because the gas temperature is still high. Closer to the disk midplane, the ortho-H2D+ + CO pathway remains inefficient because of the strong CO depletion that results from high densities. Lower densities just outside the dense ring may lead to lower CO depletion and a more efficient DCO+ formation, explaining the DCO+ peak there.
Other observed species. We also presented integrated column densities of HC3N and c-C3H2, in Table 2 and Appendix B. The modeled column densities of HC3N and c-C3H2 are overpredicted. The high column density of HC3N above three scale heights is due to its rapid formation via CN + C2H2 → H + HC3N reaction, whereas c-C3H2 forms from the CH + C2H2 reaction, photodissociation of CH2CCH and dissociative recombination of C3H5+.
5. Summary
Using NOEMA, we have observed the GG Tau A outer disk in several molecules. We report the first detection of H2S in a protoplanetary disk.
We clearly detect HCO+, H13CO+, DCO+, and H2S. HCO+ emission is extended, H13CO+ and H2S emissions peak inside the dense ring at ~250 au, while DCO+ emission arises from the outer disk beyond a radius of 300 au, perhaps as a result of competition between CO depletion and high temperatures.
Our three-phase chemical model fails to reproduce the observed column densities of S-bearing molecules, even with low S abundance and C/O = 0.7, suggesting that our understanding of S chemistry on dust grains is still incomplete.
Comparisons with other disks indicate that the detection of H2S appears to be facilitated by the large disk mass, but that the relative abundance ratios remain similar. This indicates that GG Tau A could be a good test bed for chemistry in disks.
Acknowledgments
We thank the referee for useful comments that helped improve the quality of the manuscript. This work is based on observations carried out with the IRAM NOEMA Interferometer. IRAM is supported by INSU/CNRS (France), MPG (Germany) and IGN (Spain). This work has made use of data from the European Space Agency (ESA) mission Gaia (https://www.cosmos.esa.int/gaia), processed by the Gaia Data Processing and Analysis Consortium (DPAC, https://www.cosmos.esa.int/web/gaia/dpac/consortium). Funding for the DPAC has been provided by national institutions, in particular the institutions participating in the Gaia Multilateral Agreement. A. Dutrey and S. Guilloteau thank the French CNRS programs PNP, PNPS, and PCMI. N. T. Phuong and P. N. Diep acknowledge financial support from NAFOSTED under grant number 103.99-2016.50, World Laboratory, Rencontres du Viet Nam, the Odon Vallet fellowships, Vietnam National Space Center, and Graduate University of Science and Technology. V. Wakelam’s research is funded by an ERC Starting Grant (3DICE, grant agreement 336474). L. Majumdar acknowledges support from the NASA postdoctoral program. A portion of this research was carried out at the Jet Propulsion Laboratory, California Institute of Technology, under a contract with the National Aeronautics and Space Administration.
References
- Bergin, E., Calvet, N., Sitko, M. L., et al. 2004, ApJ, 614, L133 [NASA ADS] [CrossRef] [Google Scholar]
- Bergin, E. A., Cleeves, L. I., Gorti, U., et al. 2013, Nature, 493, 644 [NASA ADS] [CrossRef] [PubMed] [Google Scholar]
- Bergin, E. A., Du, F., Cleeves, L. I., et al. 2016, ApJ, 831, 101 [NASA ADS] [CrossRef] [Google Scholar]
- Buckle, J. V., & Fuller, G. A. 2003, A&A, 399, 567 [NASA ADS] [CrossRef] [EDP Sciences] [Google Scholar]
- Butner, H. M., Lada, E. A., & Loren, R. B. 1995, ApJ, 448, 207 [NASA ADS] [CrossRef] [Google Scholar]
- Calmonte, U., Altwegg, K., Balsiger, H., et al. 2016, MNRAS, 462, S253 [CrossRef] [Google Scholar]
- Chapillon, E., Dutrey, A., Guilloteau, S., et al. 2012, ApJ, 756, 58 [NASA ADS] [CrossRef] [Google Scholar]
- Di Folco, E., Dutrey, A., Le Bouquin, J.-B., et al. 2014, A&A, 565, L2 [NASA ADS] [CrossRef] [EDP Sciences] [Google Scholar]
- Draine, B. T. 1978, ApJS, 36, 595 [NASA ADS] [CrossRef] [Google Scholar]
- Dutrey, A., Guilloteau, S., & Simon, M. 1994, A&A, 286, 149 [NASA ADS] [Google Scholar]
- Dutrey, A., Guilloteau, S., & Guelin, M. 1997, A&A, 317, L55 [NASA ADS] [Google Scholar]
- Dutrey, A., Wakelam, V., Boehler, Y., et al. 2011, A&A, 535, A104 [NASA ADS] [CrossRef] [EDP Sciences] [Google Scholar]
- Dutrey, A., di Folco, E., Guilloteau, S., et al. 2014, MNRAS, 514, 600 [Google Scholar]
- Dutrey, A., Di Folco, E., Beck, T., & Guilloteau, S. 2016, A&ARv, 24, 5 [NASA ADS] [CrossRef] [Google Scholar]
- Dutrey, A., Guilloteau, S., Piétu, V., et al. 2017, A&A, 607, A130 [NASA ADS] [CrossRef] [EDP Sciences] [Google Scholar]
- Favre, C., Fedele, D., Semenov, D., et al. 2018, ApJ, 862, L2 [NASA ADS] [CrossRef] [Google Scholar]
- Gaia Collaboration (Prusti, T., et al.) 2016, A&A, 595, A1 [NASA ADS] [CrossRef] [EDP Sciences] [Google Scholar]
- Gaia Collaboration (Brown, A. G. A., et al.) 2018, A&A, 616, A1 [NASA ADS] [CrossRef] [EDP Sciences] [Google Scholar]
- Guilloteau, S., Dutrey, A., & Simon, M. 1999, A&A, 348, 570 [NASA ADS] [Google Scholar]
- Guilloteau, S., Dutrey, A., Piétu, V., & Boehler, Y. 2011, A&A, 529, A105 [NASA ADS] [CrossRef] [EDP Sciences] [Google Scholar]
- Guilloteau, S., Di Folco, E., Dutrey, A., et al. 2013, A&A, 549, A92 [NASA ADS] [CrossRef] [EDP Sciences] [Google Scholar]
- Guilloteau, S., Reboussin, L., Dutrey, A., et al. 2016, A&A, 592, A124 [NASA ADS] [CrossRef] [EDP Sciences] [Google Scholar]
- Guzmán, V. V., Öberg, K. I., Loomis, R., & Qi, C. 2015, ApJ, 814, 53 [NASA ADS] [CrossRef] [Google Scholar]
- Hily-Blant, P., Magalhaes, V., Kastner, J., et al. 2017, A&A, 603, L6 [NASA ADS] [CrossRef] [EDP Sciences] [Google Scholar]
- Hincelin, U., Wakelam, V., Hersant, F., et al. 2011, A&A, 530, A61 [NASA ADS] [CrossRef] [EDP Sciences] [Google Scholar]
- Huang, J., & Öberg, K. I. 2015, ApJ, 809, L26 [NASA ADS] [CrossRef] [Google Scholar]
- Huang, J., Öberg, K. I., Qi, C., et al. 2017, ApJ, 835, 231 [NASA ADS] [CrossRef] [Google Scholar]
- Jiménez-Escobar, A., & Muñoz Caro, G. M. 2011, A&A, 536, A91 [NASA ADS] [CrossRef] [EDP Sciences] [Google Scholar]
- Kenyon, S. J., & Hartmann, L. 1987, ApJ, 323, 714 [Google Scholar]
- Lucas, R., & Liszt, H. 1998, A&A, 337, 246 [NASA ADS] [Google Scholar]
- Majumdar, L., Gratier, P., Ruaud, M., et al. 2017, MNRAS, 466, 4470 [Google Scholar]
- Mathews, G. S., Klaassen, P. D., Juhász, A., et al. 2013, A&A, 557, A132 [NASA ADS] [CrossRef] [EDP Sciences] [Google Scholar]
- Öberg, K. I., Furuya, K., Loomis, R., et al. 2015, ApJ, 810, 112 [NASA ADS] [CrossRef] [Google Scholar]
- Ohishi, M., Irvine, W. M., & Kaifu, N., 1992, IAU Symp., 150, 171 [Google Scholar]
- Omont, A. 2007, Rep. Prog. Phys., 70, 1099 [NASA ADS] [CrossRef] [Google Scholar]
- Piétu, V., Dutrey, A., Guilloteau, S., Chapillon, E., & Pety, J. 2006, A&A, 460, L43 [NASA ADS] [CrossRef] [EDP Sciences] [Google Scholar]
- Piétu, V., Dutrey, A., & Guilloteau, S. 2007, A&A, 467, 163 [NASA ADS] [CrossRef] [EDP Sciences] [Google Scholar]
- Punzi, K. M., Hily-Blant, P., Kastner, J. H., Sacco, G. G., & Forveille, T. 2015, ApJ, 805, 147 [NASA ADS] [CrossRef] [Google Scholar]
- Qi, C., Wilner, D. J., Aikawa, Y., Blake, G. A., & Hogerheijde, M. R. 2008, ApJ, 681, 1396 [NASA ADS] [CrossRef] [Google Scholar]
- Qi, C., Öberg, K. I., Wilner, D. J., et al. 2013, Science, 341, 630 [NASA ADS] [CrossRef] [PubMed] [Google Scholar]
- Ruaud, M., Wakelam, V., & Hersant, F. 2016, MNRAS, 459, 3756 [NASA ADS] [CrossRef] [Google Scholar]
- Salinas, V. N., Hogerheijde, M. R., Bergin, E. A., et al. 2016, A&A, 591, A122 [NASA ADS] [CrossRef] [EDP Sciences] [Google Scholar]
- Semenov, D., Favre, C. & Fedele, D. 2018, A&A, in press, DOI: 10.1051/0004-6361/201832980 [EDP Sciences] [Google Scholar]
- Tang, Y.-W., Dutrey, A., Guilloteau, S., et al. 2016, ApJ, 820, 19 [NASA ADS] [CrossRef] [Google Scholar]
- Thi, W. F., van Dishoeck, E. F., Blake, G. A., et al. 2001, ApJ, 561, 1074 [NASA ADS] [CrossRef] [Google Scholar]
- van Dishoeck, E. F., Thi, W.-F., & van Zadelhoff, G.-J. 2003, Ap&SS, 285, 691 [NASA ADS] [CrossRef] [Google Scholar]
- van Zadelhoff, G.-J., van Dishoeck, E. F., Thi, W.-F., & Blake, G. A. 2001, A&A, 377, 566 [NASA ADS] [CrossRef] [EDP Sciences] [Google Scholar]
- Vidal, T. H. G., Loison, J.-C., Jaziri, A. Y., et al. 2017, MNRAS, 469, 435 [NASA ADS] [CrossRef] [Google Scholar]
- Wakelam, V., Caselli, P., Ceccarelli, C., Herbst, E., & Castets, A. 2004a, A&A, 422, 159 [NASA ADS] [CrossRef] [EDP Sciences] [Google Scholar]
- Wakelam, V., Castets, A., Ceccarelli, C., et al. 2004b, A&A, 413, 609 [NASA ADS] [CrossRef] [EDP Sciences] [Google Scholar]
- Wakelam, V., Ceccarelli, C., Castets, A., et al. 2005, A&A, 437, 149 [NASA ADS] [CrossRef] [EDP Sciences] [Google Scholar]
- Wakelam, V., Ruaud, M., Hersant, F., et al. 2016, A&A, 594, A35 [NASA ADS] [CrossRef] [EDP Sciences] [Google Scholar]
- Walsh, C., Loomis, R. A., Öberg, K. I., et al. 2016, ApJ, 823, L10 [NASA ADS] [CrossRef] [Google Scholar]
Appendix A
Channel maps
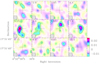 |
Fig. A.1. Channel maps H2S 1(1,0)–1(0,1) emission. The color scale is in the unit of Jy beam−1. The contour spacing is 10 mJy beam−1, which corresponds to 2σ or 0.08 K. The beam (2.55″ × 1.90″, PA = 14°) is inserted in the lower corner of each channel map. |
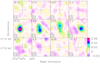 |
Fig. A.2. Channel maps H13CO+ (2–1) emission. The color scale is in the unit of Jy beam−1. The contour spacing is 12 mJy beam−1, which corresponds to 2σ or 0.11 K. The beam (2.50″ × 1.85″, PA = 15°) is inserted in the lower corner of each channel map. |
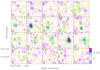 |
Fig. A.3. Channel maps DCO+ (3–2) emission. The color scale is in the unit of Jy beam−1. The contour spacing is 18 mJy beam−1, which corresponds to 2σ or 0.22 K. The beam (1.76″ × 1.23″, PA = 17°) is inserted in the lower corner of each channel map. |
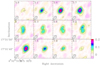 |
Fig. A.4. Channel maps HCO+ (1–0) emission. The color scale is in the unit of Jy beam−1. The contour spacing is 25 mJy beam−1, which corresponds to 2σ or 0.33 K. The beam (4.57″ × 2.55″, PA = −38°) is inserted in the lower corner of each channel map. |
Appendix B
Vertical integrated molecule column densities
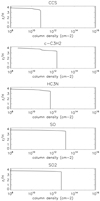 |
Fig. B.1. Best model of CCS, c-C3H2, HC3N, SO, and SO2 in the GG Tau A ring, derived from Nautilus, using our best knowledge of the GG Tau disk. |
All Tables
All Figures
|
Fig. 1. Upper row: integrated intensity maps. The color scale is in the unit of (Jy beam−1 km s−1). Contour level step is 2σ. Lower row: velocity maps. Contour level step is 0.5 km s−1. Beam sizes are indicated. The ellipses show the location of inner (~180 au) and outer (~260 au) radii of the dust ring. |
| In the text | |
|
Fig. 2. Best model of H2S, CS, DCO+, and HCO+ in the GG Tau A ring derived from Nautilus. The surface density is shown vs. the z/H ratio (z/H=1 means 1 scale height). |
| In the text | |
|
Fig. A.1. Channel maps H2S 1(1,0)–1(0,1) emission. The color scale is in the unit of Jy beam−1. The contour spacing is 10 mJy beam−1, which corresponds to 2σ or 0.08 K. The beam (2.55″ × 1.90″, PA = 14°) is inserted in the lower corner of each channel map. |
| In the text | |
|
Fig. A.2. Channel maps H13CO+ (2–1) emission. The color scale is in the unit of Jy beam−1. The contour spacing is 12 mJy beam−1, which corresponds to 2σ or 0.11 K. The beam (2.50″ × 1.85″, PA = 15°) is inserted in the lower corner of each channel map. |
| In the text | |
|
Fig. A.3. Channel maps DCO+ (3–2) emission. The color scale is in the unit of Jy beam−1. The contour spacing is 18 mJy beam−1, which corresponds to 2σ or 0.22 K. The beam (1.76″ × 1.23″, PA = 17°) is inserted in the lower corner of each channel map. |
| In the text | |
|
Fig. A.4. Channel maps HCO+ (1–0) emission. The color scale is in the unit of Jy beam−1. The contour spacing is 25 mJy beam−1, which corresponds to 2σ or 0.33 K. The beam (4.57″ × 2.55″, PA = −38°) is inserted in the lower corner of each channel map. |
| In the text | |
|
Fig. B.1. Best model of CCS, c-C3H2, HC3N, SO, and SO2 in the GG Tau A ring, derived from Nautilus, using our best knowledge of the GG Tau disk. |
| In the text | |
Current usage metrics show cumulative count of Article Views (full-text article views including HTML views, PDF and ePub downloads, according to the available data) and Abstracts Views on Vision4Press platform.
Data correspond to usage on the plateform after 2015. The current usage metrics is available 48-96 hours after online publication and is updated daily on week days.
Initial download of the metrics may take a while.