Table 5.
Detailed feature branches obtained from the feature selection for the DR7+9 experiment.
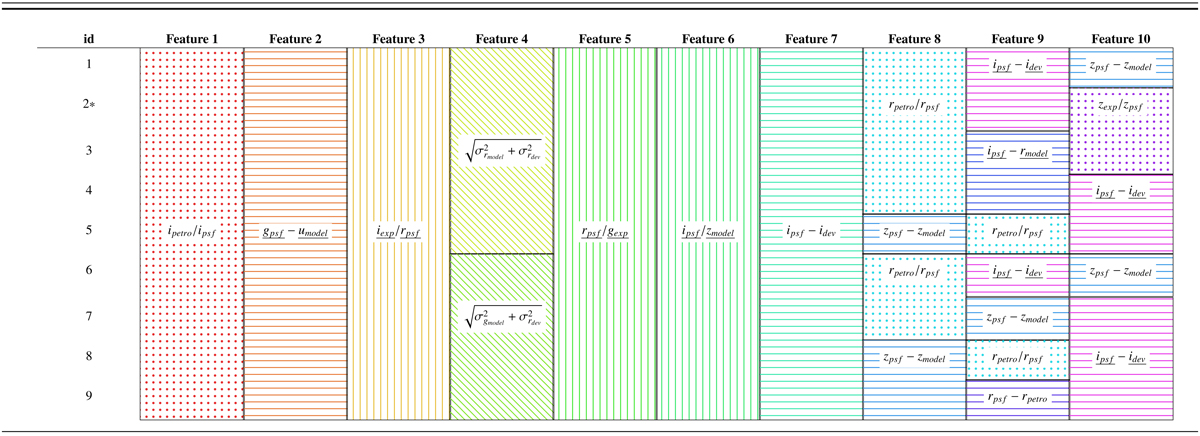
Notes. The 2nd branch, indicated with the symbol, is the best performing subset with respect to the experiments using the RF. The ratios and photometric ratios are indicated, respectively, with vertical lines and dots. The differences are with horizontal lines and the errors are with north west lines. The colour code for the features is the same as shown in the chord diagram in Fig. 3.
Current usage metrics show cumulative count of Article Views (full-text article views including HTML views, PDF and ePub downloads, according to the available data) and Abstracts Views on Vision4Press platform.
Data correspond to usage on the plateform after 2015. The current usage metrics is available 48-96 hours after online publication and is updated daily on week days.
Initial download of the metrics may take a while.