Fig. 9.
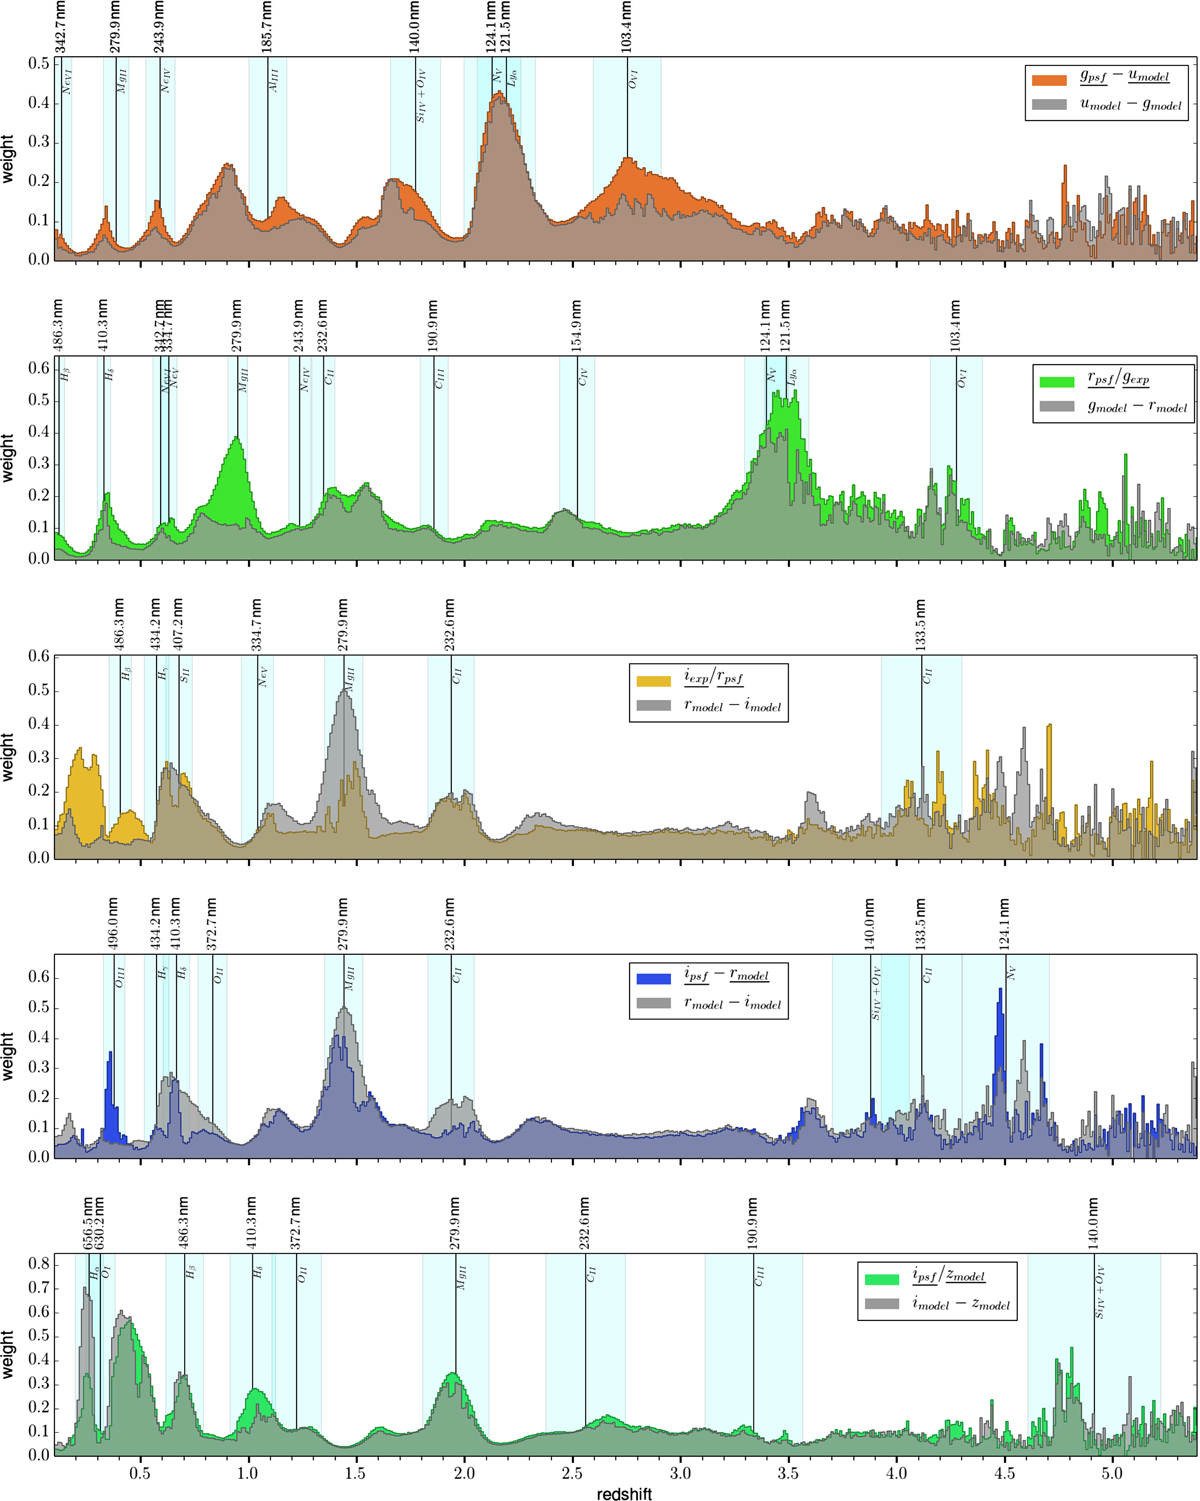
Feature importance of the five features from the Best10 set composed by magnitudes from neighbouring bands. As in Fig. 7, for a sliding redshift bin of Δz = 0.2, the importance of every feature was calculated. The results are compared to the classic features using model magnitudes of the same bands. Based on the characteristics of the ugriz filters, the wavelengths indicating the start, centre, and end of the overlapping regions are used to overplot the positions of particular quasar emission lines using Eq. (2). The used colour code is the same as in Fig. 3, while corresponding features of the Classic10 set are always shown in grey.
Current usage metrics show cumulative count of Article Views (full-text article views including HTML views, PDF and ePub downloads, according to the available data) and Abstracts Views on Vision4Press platform.
Data correspond to usage on the plateform after 2015. The current usage metrics is available 48-96 hours after online publication and is updated daily on week days.
Initial download of the metrics may take a while.