Fig. 6.
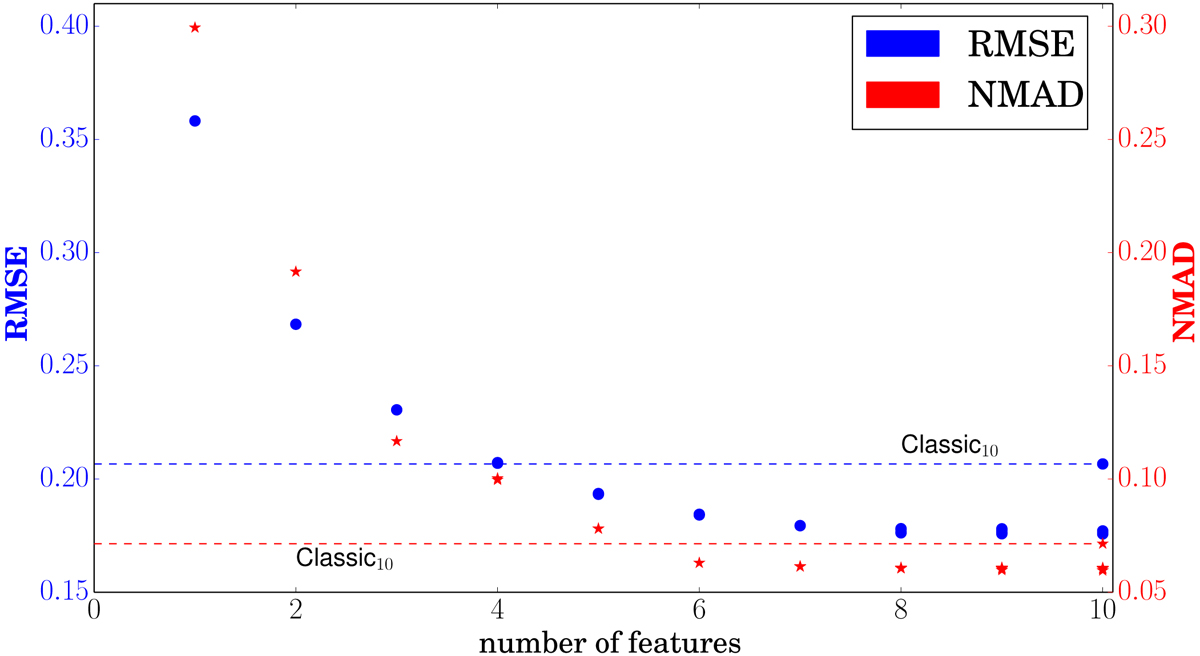
Comparison of model performance with regard to the number of used features. The root mean square error and normalized median absolute deviation of the results from the DR7+9 RF experiments are presented. As reference line the performance achieved with the Classic10 features is shown. As it can be seen, from the fourth feature on, the performance of the subsets outperforms the Classic10 features. After the ninth feature, the improvement settles. When adding many more features, the performance will start to degrade.
Current usage metrics show cumulative count of Article Views (full-text article views including HTML views, PDF and ePub downloads, according to the available data) and Abstracts Views on Vision4Press platform.
Data correspond to usage on the plateform after 2015. The current usage metrics is available 48-96 hours after online publication and is updated daily on week days.
Initial download of the metrics may take a while.