Fig. 3.
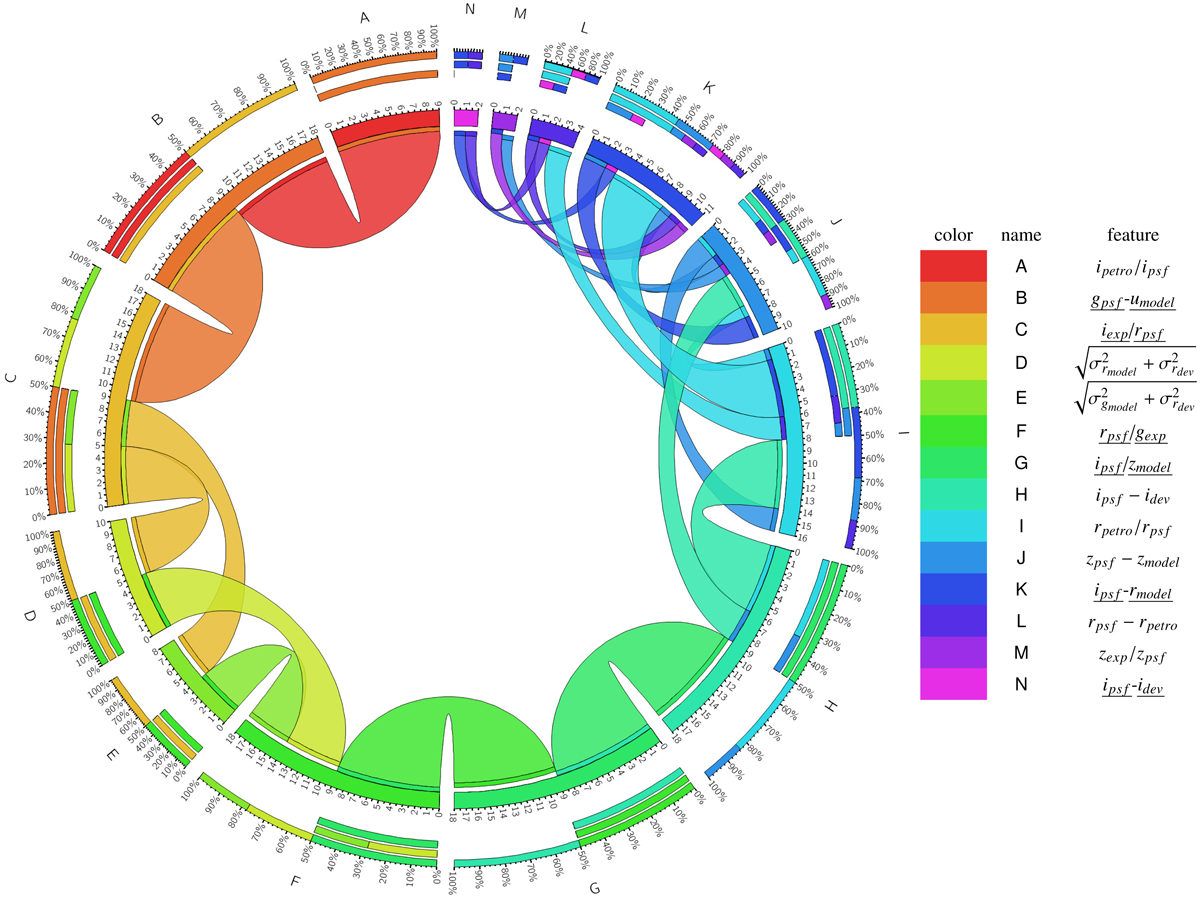
Chord diagram of the features derived in Experiment DR7+9. Every feature is associated to a specific colour, and starting from the first feature A it is possible to follow all the possible paths of the tree, depicting the different feature subsets. Ordered from outside to inside, the external arcs represent the occurrences of a particular feature: the total percentage of the individual connections, the numbers and sources of connections entering, and the numbers and targets of connections exiting. (Note the branches splitting in feature C and re-joining in feature F).
Current usage metrics show cumulative count of Article Views (full-text article views including HTML views, PDF and ePub downloads, according to the available data) and Abstracts Views on Vision4Press platform.
Data correspond to usage on the plateform after 2015. The current usage metrics is available 48-96 hours after online publication and is updated daily on week days.
Initial download of the metrics may take a while.