Free Access
Fig. 2.
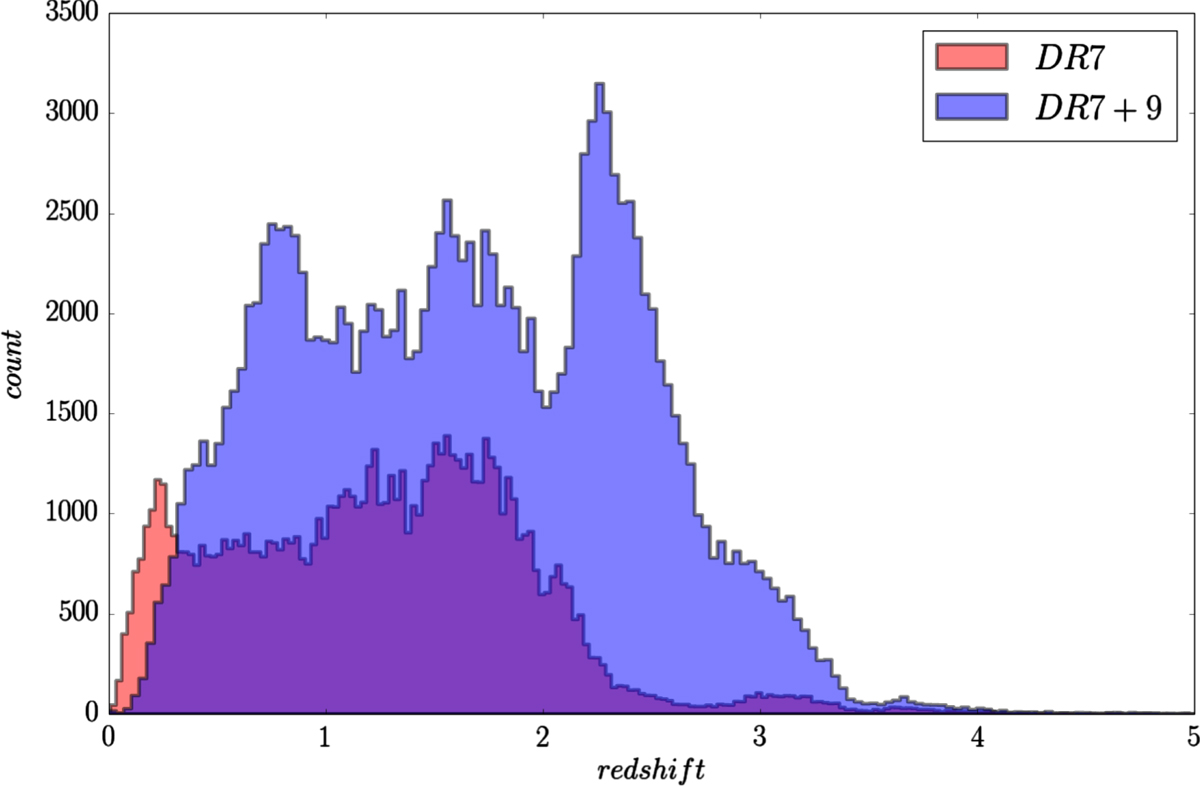
Histogram showing the redshift distribution of the catalogues with objects from DR7 only and DR7 plus DR9. The distribution for the catalogue DR7b is not reported here because the difference with respect to catalogue DR7a is practically negligible.
Current usage metrics show cumulative count of Article Views (full-text article views including HTML views, PDF and ePub downloads, according to the available data) and Abstracts Views on Vision4Press platform.
Data correspond to usage on the plateform after 2015. The current usage metrics is available 48-96 hours after online publication and is updated daily on week days.
Initial download of the metrics may take a while.