| Issue |
A&A
Volume 616, August 2018
|
|
|---|---|---|
| Article Number | A36 | |
| Number of page(s) | 5 | |
| Section | Stellar structure and evolution | |
| DOI | https://doi.org/10.1051/0004-6361/201833086 | |
| Published online | 10 August 2018 | |
EXTraS discovery of a peculiar flaring X-ray source in the Galactic globular cluster NGC 6540
1
INAF - Istituto di Astrofisica Spaziale e Fisica Cosmica Milano, Via E. Bassini 15, 20133 Milano, Italy
e-mail: This email address is being protected from spambots. You need JavaScript enabled to view it.
2
Dipartimento di Fisica G. Occhialini, Università degli Studi di Milano Bicocca, Piazza della Scienza 3, 20126 Milano, Italy
3
IUSS, Piazza della Vittoria 15, 27100 Pavia, Italy
4
INFN, Sezione di Pavia, Via A. Bassi 6, 27100 Pavia, Italy
Received:
23
March
2018
Accepted:
1
June
2018
Abstract
We report the discovery of a flaring X-ray source 7″ from the center of the globular cluster NGC 6540 obtained during the EXTraS project devoted to a systematic search for variability in archival data of the XMM–Newton satellite. The source had a quiescent X-ray luminosity on the order of ~1032 erg s−1 in the 0.5–10 keV range (for a distance of NGC 6540 of 4 kpc) and showed a flare lasting about 300 s. During the flare, the X-ray luminosity increased by more than a factor 40, with a total emitted energy of ~1036 erg. These properties, as well as Hubble Space Telescope photometry of the possible optical counterparts, suggest the identification with a chromospherically active binary in the cluster. However, the flare luminosity is significantly higher than what is commonly observed in stellar flares of such a short duration, leaving open the possibility of other interpretations.
Key words: globular clusters: individual: NGC 6540 / stars: flare / X-rays: binaries / X-rays: bursts
© ESO 2018
1. Introduction
Globular clusters host a large number of X-ray sources. The luminous sources (LX > 1036 erg s−1) were soon recognized as low mass X-ray binaries (LMXB) containing neutron stars, owing to the detection of type I X-ray bursts in many of these sources and to their overall properties similar to those of LMXBs in the field (Grindlay et al. 1984). The nature of the much larger population of sources with lower X-ray luminosity has been more difficult to understand. It is now clear that low luminosity sources (<1035 erg s−1) in globular clusters comprise a mix of different classes, including compact objects powered by accretion and/or rotation (transient LMXBs in quiescence, cataclysmic variables, and millisecond pulsars), as well as nondegenerate stars with enhanced X-ray emission related to chromospheric activity (see, e.g., Heinke 2010).
We report the discovery of a transient X-ray source with peculiar variability properties in the globular cluster NGC 6540. This result was obtained in the course of EXTraS1, which is an EU/FP7 project devoted to a systematic variability study of the X-ray sources in the XMM–Newton public archive (De Luca et al. 2016).
NGC 6540 is located in the Galactic bulge and distances between 3 and 5.3 kpc have been derived by various authors (see Rossi et al. 2015, and references therein). In the following we give all the distance-dependent quantities normalized to an assumed value d4 = d/4 kpc.
2. Data analysis and results
2.1. XMM–Newton
NGC 6540 was observed with XMM–Newton for about 9 ks on 2005 September 21, starting at 03:09 UT. Our results are based on data obtained with the three CCD cameras of the EPIC instrument. During this observation, all of the cameras used the medium thickness optical filter and were operated in full imaging mode, resulting in a time resolution of 73 ms for the pn camera (Strüder et al. 2001) and 2.6 s for the two MOS cameras (Turner et al. 2001).
The left panel of Fig. 1 shows a 8′ × 8′ region of the 0.2–12 keV image obtained by summing the data of the three EPIC cameras. This image, integrated over the whole observation, shows the presence of four sources. The variable source, at coordinates RA = 18h 6m 8.9s, Dec = −27° 45′ 53″, is indicated by the arrow. Its light curve is shown in Fig. 2, where a flare lasting about 300 s is clearly visible.
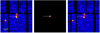 |
Fig. 1. X-ray images of a 8′ × 8′ field toward NGC 6540 (north to the top, east to the left). The images are obtained by summing the data of the three EPIC cameras in the 0.2–12 keV energy range. Left panel: whole observation with an exposure time of about 9 ks. Center panel: a 300 s time interval centered on the flare. Right panel: whole observation with the above time interval excluded. The source indicated by the arrow is clearly variable; the majority of its counts are detected during the short time interval containing the flare, but the source is also visible when the time interval containing the flare is excluded. |
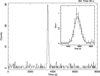 |
Fig. 2. X-ray light curve (PN+MOS) of the transient source J1806–27 with a bin time of 30 s. Start time is set at the beginning of the pn observation (MJD = 53634.14811 – all times are in Barycentric Dynamical Time). The inset shows a zoom on the flare. Error bars are computed according to Gehrels (1986). The flare is well described by a Gaussian centered at MJD = 53634.18937 ± 0.00014 and with σ = 54 ± 11 s. |
This source is also present in the 3XMM Catalog of XMM–Newton serendipitous sources (Rosen et al. 2016) and is called 3XMM J180608.9–274553. In the following we refer to this source with the abbreviated name J1806–27.
The middle panel of Fig. 1 shows the same sky region accumulated during the short time interval (300 s) corresponding to the flare. J1806–27 is detected with high significance in this image, which is too short to reveal the other sources, but it is also visible when the flare time interval is excluded, as shown in the right panel of Fig. 1.
Considering the limited count statistics, we extracted the source spectra during the flare using a maximum likelihood (ML) method, as described in Rigoselli & Mereghetti (2018). The spectra obtained with the pn (130 net counts) and with the sum of the two MOS (121 net counts) were fitted simultaneously. An absorbed power law gave a good fit with photon index Γ = 1.7 ± 0.2, absorption NH = (6 ± 2) × 1021 cm−2, and absorbed flux of 2.7 × 10⁻¹² erg cm−2 s−1 (0.5–10 keV). Acceptable fits were also obtained with other single component models (blackbody, thermal bremsstrahlung, thermal plasma emission, and multi-blackbody disk emission); the best-fit parameters are summarized in Table 1.
Results of the spectral fits of J1806–27
With the ML method it was also possible to extract the spectra of J1806–27 during the quiescent emission, i.e., from the whole observation excluding the time interval of the flare. This yielded exposure times of 6.5 ks in the pn and 8.8 ks in the MOS (100 and 85 source counts, respectively). To avoid contamination from a nearby persistent source (at only 18″ from J1806–27, see Fig. 1), we included it in the ML model and extracted simultaneously the spectra of the two sources. In the spectral fits of J1806–27, we fixed the absorption at the values derived from the spectrum of the flare with the corresponding model. We found a quiescent source flux slightly smaller than 10−13 erg cm−2 s−1 and, although the uncertainties are large, there is some evidence that the spectrum during the quiescent period is softer than that of the flaring emission (see Table 1).
2.2. Chandra
NGC 6540 was observed with the Chandra ACIS instrument (Garmire et al. 2003) for 5.1 ks on 2008 November 1. The target was imaged on the backside-illuminated Chip S3 of the ACIS-S array. A source detection, in the 0.3–8 keV energy range, revealed several sources in the cluster region, including one positionally coincident with J1806–27 and with a count rate consistent with that observed for its quiescent level with XMM–Newton.
We improved the Chandra astrometry by cross-correlating X-ray sources with the 2MASS catalog (also used as a reference for HST astrometry, see next section). We used 25 Chandra sources located within 4 arcmin of the aimpoint, where the sharper point spread function yields a better localization accuracy. We found five matches within a correlation distance of 0.5″ – no more matches were found up to distances larger than 1″. In view of the 2MASS source density of ~ 8.3 × 10⁻³ sources per square arcsec, these five matches have a chance occurrence probability of ~ 8 × 10⁻⁷ – these are very likely the actual X-ray counterparts of the 2MASS sources. Adopting the five sources as a reference, we computed the best position of J1806–27 to be RA = 18h 06m 09.11s, Dec = −27° 45′ 54.8″. The 1σ error ellipse, shown by the solid line in Fig. 3, has semiaxis of 0.65″ and 0.38″ along RA and Dec, respectively. They include the uncertainty of the registration of both the HST and the Chandra image to the 2MASS reference frame, as well as the statistical uncertainty on the localization of the X-ray source. The Chandra position is at a distance of 7″ from the center of the cluster (RA = 18h 06m 08.6s, Dec = −27° 45′ 55″; Djorgovski 1987).
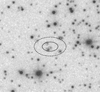 |
Fig. 3. Optical image of a ~8″ × 8″ region centered at the position of J1806–27 obtained with the planetary camera in the F555W filter. North is to the top, east to the left. The error region of the transient source J1806–27 derived from the Chandra data is overplotted; the inner and outer ellipses indicate the 68% and 99% uncertainty region, respectively (see text for more detail). The seven HST sources closest to the Chandra coordinates are indicated; their position in the color-magnitude diagram is shown in Fig. 4. |
2.3. Hubble Space Telescope
The field of NGC 6540 was visited by the Hubble Space Telescope on 2000 May 18 within a snapshot survey of Galactic globular clusters (Prop. Id. 8118, Piotto et al. 2002). Short observations were performed with the Wide Field and Planetary Camera 2 (WFPC2) instrument in the F439W band (λ = 4311 Å, Δλ= 473 Å) and F555W band (λ = 5439 Å, Δλ= 1228 Å) with exposure times of 360 s and 45 s, respectively. More recently (2016, July 19), the field was observed in the near-infrared with the Wide Field Camera 3 (WFC3) instrument in the F110W band (λ = 11534 Å, Δλ = 1428 Å) and F160W band (λ = 15369 Å, Δλ = 826 Å) with exposure times of 1240 s and 1270 s, respectively. We retrieved calibrated, geometrically corrected images from the Hubble Legacy Archive (HLA2). The HLA WFPC2 images have an accurate astrometry, based on cross-correlation of sources with astrometric catalogs – the images of our field have a rms accuracy of 0.17″ per coordinate based on 176 reference sources in 2MASS. Such an accurate astrometry is not provided for WFC3 images in the HLA. We computed a more refined astrometric solution by cross-correlating WFC3 sources with the 2MASS catalog, with a rms accuracy of ~0.16″ per coordinate, based on more than 100 reference sources. We ran a source detection using the SExtractor software (Bertin & Arnouts 1996) and cross-correlated the results of the two bands to generate a common source list. We performed aperture photometry using 0.3″ radii and applying standard aperture correction (Gonzaga et al. 2010). We converted count rates to magnitudes in the AB system by using the photometric information provided by the HLA pipeline. Color-magnitude diagrams based on the images in the F439W, F555W, and F160W filters, not corrected for reddening, are shown in Fig. 4, where sources positionally consistent with the Chandra error ellipse are highlighted.
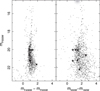 |
Fig. 4. Color-magnitude diagrams for the cluster NGC 6540. Magnitudes are in the AB system and are not corrected for reddening. Seven sources positionally consistent with the Chandra error ellipse of J1806–27 are indicated by the stars. |
3. Discussion
The fluxes of the variable source J1806–27 derived in the previous section, corrected for the interstellar absorption, imply a quiescent X-ray (0.5–10 keV) luminosity of LQ = (0.6–2.3) × 1032 erg s−1 and an average luminosity during the flare of LF = (4–8) × 1033
 erg s−1, where the quoted intervals account for the statistical errors and for the uncertainties on the spectral shape.
If J1806–27 is located in NGC 6540, the flare luminosity is much smaller than that typically seen during the outbursts of LMXB transients. Furthermore, such outbursts have much longer durations, lasting at least a few days and, more often, several weeks (see, e.g., Campana et al. 1998). In addition to the classical LMXB transients, there is a class of so-called very-faint X-ray transients (VFXTs) that show fainter outbursts, reaching peak luminosities of only 1034−36 erg s−1 (e.g., Degenaar & Wijnands 2009). The occurrence of type I bursts shows that at least some VFXTs are accreting neutron stars in LMXBs, but also other interpretations have been proposed. Considering the uncertainties on the distance of NGC 6540, the peak luminosity reached during the flare of J1806–27 is marginally consistent with the range observed in VFXTs, which however show outbursts of much longer duration.
The short duration of the flare observed in J1806–27 is more reminiscent of a type I burst. However, type I bursts have a much higher luminosity (~1037−38.5 erg s−1) and their light curves are characterized by a sharp rise (≲10 s) followed by a longer decay during which the spectrum softens (see, e.g., Galloway et al. 2008). These properties are at variance with those of J1806–27 and point against this interpretation.
Our results on J1806–27 bear some resemblance with those obtained during an ASCA satellite observation of the globular cluster M28 by Gotthelf & Kulkarni (1997). These authors observed a short flare with peak luminosity of 4 × 1036 erg s−1 and interpreted it as a peculiar type I burst. They explained the unusually low luminosity as due to emission from a very small region (0.1–1%) of the neutron star surface, as it would be expected in the presence of a magnetic field higher than that of normal X-ray bursters. The event seen in M28 differs from that we observed in J1806–27 because it showed a very fast rise time (≲70 ms) and an exponential decay with characteristic time τ = 7.5 s. On the contrary, the light curve of the J1806–27 flare has a fairly symmetric profile that is well fitted by a Gaussian with σ = 54 ± 11 s (see inset of Fig. 2).
Globular clusters also contain a large population of millisecond pulsars and cataclysmic variables. The quiescent luminosity of J1806–27 is consistent with the values observed in these classes of objects (Grindlay & Bogdanov 2009; Kuulkers et al. 2006), which, however, do not show flares or outbursts with the characteristics seen in our data. Furthermore, none of the possible optical counterparts of J1806–27 highlighted in Fig. 4 has a particularly blue color.
In summary, the properties of the new transient J1806–27 are at variance with those observed up to now in all the classes of neutron stars and white dwarf sources present in globular clusters. In the following, we consider the alternative explanation in terms of a stellar X-ray flare.
The brightest stellar X-ray flares, reaching peak luminosities up to 1033−34 erg s−1, are emitted by RS CVn stars. RS CVn are binary systems, with orbital periods shorter than 10 days, formed by a giant or subgiant G- or K-type star plus a latetype main-sequence or subgiant star. A fast rotation rate is believed to be at the origin of their large coronal X-ray luminosity, typically in the range 1029−32 erg s−1 (Walter & Bowyer 1981; Dempsey et al. 1993). BY Dra-type stars are another related class of chromospherically active binaries, in which the two components are late-type dwarfs. These stars have, on average, slightly lower X-ray luminosity than the RS CVns. X-ray sources associated with RS CVn and BY Dra systems have been found in globular clusters (e.g., in NGC 6752, Pooley et al. 2002; in ω Cen, Gendre et al. 2003; in 47 Tuc, Edmonds et al. 2003).
The values of LQ of J1806–27, as well as the apparent magnitudes and colors of its possible optical counterparts, are consistent with an active binary in NGC 6540. For example, a K-type dwarf with absolute magnitude MV = 6 and intrinsic color (V − R)0 ~ 0.7, at a distance of 4 kpc and with a reddening corresponding to that of NGC 6540 (EB−V = 0.7) would have an apparent magnitude mV ~ 21. As another comparison, we refer to the HST photometry of the faint X-ray sources associated with active binaries in 47 Tuc (Edmonds et al. 2003), which has a distance (4.5 kpc) similar to that of NGC 6540. These sources have optical properties spanning a broad region of the CMD, which is consistent with that of the candidate counterparts of J1806–27.
The interpretation of the observed variable emission as a stellar flare leads us to adopt the spectral results obtained with the thermal bremsstrahlung fit (see Table 1). The flare average luminosity corresponds to an emission measure of 4 × 1056
 cm−3. This is rather high, but still compatible with the values observed in strong flares from RS CVn stars (Tsuboi et al. 2016). On the other hand the flare from J1806–27 is particularly luminous in relation to its short duration, as can be seen in Fig. 5, where these properties are plotted for a large sample of stellar flares recently compiled by Tsuboi et al. (2016). All the flares lasting less than 600 s have luminosities in the range 1028–1030 erg s−1. There is a correlation between the X-ray luminosity and duration, τ, of the flares. When solar flares and microflares are also included, such a correlation holds over 12 orders of magnitude in luminosity, and gives τ ∝
  (see Fig. 5 of Tsuboi et al. 2016). This would predict a luminosity of a few 1025 erg s−1 for a flare with τ = 300 s, which is much fainter than that observed from J1806–27.
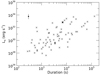 |
Fig. 5. Comparison of duration and luminosity of the flare from J1806–27 (black dot) with those of a sample of flares from chromospherically active stars (Tsuboi et al. 2016, and references therein). The error bar on the luminosity of J1806–27 is dominated by the uncertainty on the distance, for which we have assumed the range of values reported in the literature (3–5.3 kpc, see text). |
Of course, a much better agreement with the durationluminosity relation for stellar flares would be obtained if J1806–27 were a foreground source not related to NGC 6540. However, this possibility is disfavored by the faintness and colors of the optical candidate counterparts. For example, a flare with typical X-ray luminosity of 1029−30 erg s−1 (Pye et al. 2015) would require a star closer than ~50 pc. A typical dMe star (MV ~ 12) would appear brighter than mV ~ 16. A more extreme case of a M8V star (MV ~ 16) at this close distance would give an apparent magnitude mV ~ 20, but it would have a color significantly redder than those of the possible counterparts plotted in Fig. 4. Furthermore, the absorbing column density derived from the X-ray spectra would be difficult to reconcile with that expected for a source at such a small distance. We therefore believe that the explanation in terms of a foreground flaring M star is very unlikely.
4. Conclusions
The variable source J1806–27, most likely located in the Galactic globular cluster NGC 6540, was discovered thanks to the emission of a brief X-ray flare during a systematic search for variability in archival XMM–Newton data. The properties of the flare, in particular its short duration (300 s), symmetric time profile, and low luminosity ((4–8) × 1033 erg s−1), are significantly different from those typically shown by outbursts and/or type I bursts from globular cluster X-ray sources containing compact objects. An interpretation in terms of a stellar flare seems more plausible, but also in this case the source is very unusual because flares of such a high X-ray luminosity are expected to have a much longer duration.
It is possible that the unusual properties of this event reflect the fact that the EXTraS project is sampling for the first time with adequate sensitivity a region of the parameter space relatively unexplored. Indeed, short flares from relatively weak and poorly sampled sources are difficult to discover and it is interesting to note that only very few events as short as that of J1806–27 were found in the extended analysis carried out in the EXTraS project (encompassing more than 400 000 source detections listed in the 3XMM catalog, and also searching for new, undetected transients). It is remarkable that one of such short flares was found in a source positionally coincident with the central part of a globular cluster.
Further investigation of the candidate optical counterparts can shed light on the nature of J1806–27, possibly confirming the identification with a chromospherically active binary. However, also considering the large number of compact objects present in globular clusters other more exotic explanations (e.g., some form of flaring magnetar-like emission from a neutron star, or a peculiar outburst from a compact object) cannot be excluded.
Acknowledgments
J1806–27 was selected as a potentially interesting source by L. Apollonio, B. Bottazzi-Baldi, M. Giobbio, R. F. Patrolea, E. Pecchini and C. A. Torrente (Liceo Scientifico G. B. Grassi, Saronno) during their stage at INAF-IASF Milano in 2017, September, within the Alternanza Scuola-Lavoro initiative of the Italian Ministry of Education, University and Research. This work is based on observations obtained with XMM-Newton, an ESA science mission with instruments and contributions directly funded by ESA Member States and NASA. We acknowledge financial support from the Italian Space Agency (ASI) through the ASI-INAF agreements 2015-023-R.0 and 2017-14-H.0. This research has made use of data produced by the EXTraS project, funded by the European Union’s Seventh Framework Programme under grant agreement n. 607452. The EXTraS project acknowledges the usage of computing facilities at INAF - Astronomical Observatory of Catania. The EXTraS project acknowledges the CINECA award under the ISCRA initiative, for the availability of high performance computing resources and support. This work is partly based on observations made with the NASA/ESA Hubble Space Telescope, and obtained from the Hubble Legacy Archive, which is a collaboration between the Space Telescope Science Institute (STScI/NASA), the Space Telescope European Coordinating Facility (ST-ECF/ESA) and the Canadian Astronomy Data Centre (CADC/NRC/CSA). We also used observations made by the Chandra X-ray Observatory, and obtained from the Chandra Data Archive.
References
- Bertin, E., & Arnouts, S. 1996, A&AS, 117, 393 [NASA ADS] [CrossRef] [EDP Sciences] [Google Scholar]
- Campana, S., Colpi, M., Mereghetti, S., Stella, L., & Tavani, M. 1998, A&ARv., 8, 279 [NASA ADS] [CrossRef] [Google Scholar]
- Degenaar, N., & Wijnands, R. 2009, A&A, 495, 547 [NASA ADS] [CrossRef] [EDP Sciences] [Google Scholar]
- De Luca, A., Salvaterra, R., Tiengo, A., et al. 2016, Ap&SS Proc., 42, 291 [Google Scholar]
- Dempsey, R. C., Linsky, J. L., Fleming, T. A., & Schmitt, J. H. M. M. 1993, ApJS, 86, 599 [NASA ADS] [CrossRef] [Google Scholar]
- Djorgovski, S. 1987, ApJ, 317, L13 [NASA ADS] [CrossRef] [Google Scholar]
- Edmonds, P. D., Gilliland, R. L., Heinke, C. O., & Grindlay, J. E. 2003, ApJ, 596, 1177 [NASA ADS] [CrossRef] [Google Scholar]
- Galloway, D. K., Muno, M. P., Hartman, J. M., Psaltis, D., & Chakrabarty, D. 2008, ApJS, 179, 360 [NASA ADS] [CrossRef] [Google Scholar]
- Garmire, G. P., Bautz, M. W., Ford, P. G., Nousek, J. A., & Ricker, G. R., Jr. 2003, Proc. SPIE, 4851, 28 [NASA ADS] [CrossRef] [Google Scholar]
- Gehrels, N. 1986, ApJ, 303, 336 [NASA ADS] [CrossRef] [Google Scholar]
- Gendre, B., Barret, D., & Webb, N. A. 2003, A&A, 400, 521 [NASA ADS] [CrossRef] [EDP Sciences] [Google Scholar]
- Gonzaga, S., & Biretta, J., et al. 2010, in HST WFPC2 Data Handbook, v. 5.0 (Baltimore: STScI) [Google Scholar]
- Gotthelf, E. V., & Kulkarni, S. R. 1997, ApJ, 490, L161 [NASA ADS] [CrossRef] [Google Scholar]
- Grindlay, J. E., & Bogdanov, S. 2009, Astrophys. Space Sci. Lib., 357, 165 [NASA ADS] [CrossRef] [Google Scholar]
- Grindlay, J. E., Hertz, P., Steiner, J. E., Murray, S. S., & Lightman, A. P. 1984, ApJ, 282, L13 [NASA ADS] [CrossRef] [Google Scholar]
- Heinke, C. O. 2010, Am. Inst. Phys. Conf. Ser., 1314, 135 [NASA ADS] [Google Scholar]
- Kuulkers, E., Norton, A., Schwope, A., & Warner, B. 2006, Compact Stellar X-ray Sources, 39, 421 [NASA ADS] [CrossRef] [Google Scholar]
- Piotto, G., King, I. R., Djorgovski, S. G., et al. 2002, A&A, 391, 945 [NASA ADS] [CrossRef] [EDP Sciences] [Google Scholar]
- Pooley, D., Lewin, W. H. G., Homer, L., et al. 2002, ApJ, 569, 405 [NASA ADS] [CrossRef] [Google Scholar]
- Pye, J. P., Rosen, S., Fyfe, D., & Schröder, A. C. 2015, A&A, 581, A28 [NASA ADS] [CrossRef] [EDP Sciences] [Google Scholar]
- Rigoselli, M., & Mereghetti, S. 2018, A&A, 615, A73 [NASA ADS] [CrossRef] [EDP Sciences] [Google Scholar]
- Rosen, S. R., Webb, N. A., Watson, M. G., et al. 2016, A&A, 590, A1 [NASA ADS] [CrossRef] [EDP Sciences] [Google Scholar]
- Rossi, L. J., Ortolani, S., Barbuy, B., Bica, E., & Bonfanti, A. 2015, MNRAS, 450, 3270 [NASA ADS] [CrossRef] [Google Scholar]
- Strüder, L., Briel, U., Dennerl, K., et al. 2001, A&A, 365, L18 [NASA ADS] [CrossRef] [EDP Sciences] [Google Scholar]
- Tsuboi, Y., Yamazaki, K., Sugawara, Y., et al. 2016, PASJ, 68, 90 [NASA ADS] [CrossRef] [Google Scholar]
- Turner, M. J. L., Abbey, A., Arnaud, M., et al. 2001, A&A, 365, L27 [NASA ADS] [CrossRef] [EDP Sciences] [Google Scholar]
- Walter, F. M., & Bowyer, S. 1981, ApJ, 245, 671 [NASA ADS] [CrossRef] [Google Scholar]
All Tables
All Figures
|
Fig. 1. X-ray images of a 8′ × 8′ field toward NGC 6540 (north to the top, east to the left). The images are obtained by summing the data of the three EPIC cameras in the 0.2–12 keV energy range. Left panel: whole observation with an exposure time of about 9 ks. Center panel: a 300 s time interval centered on the flare. Right panel: whole observation with the above time interval excluded. The source indicated by the arrow is clearly variable; the majority of its counts are detected during the short time interval containing the flare, but the source is also visible when the time interval containing the flare is excluded. |
| In the text | |
|
Fig. 2. X-ray light curve (PN+MOS) of the transient source J1806–27 with a bin time of 30 s. Start time is set at the beginning of the pn observation (MJD = 53634.14811 – all times are in Barycentric Dynamical Time). The inset shows a zoom on the flare. Error bars are computed according to Gehrels (1986). The flare is well described by a Gaussian centered at MJD = 53634.18937 ± 0.00014 and with σ = 54 ± 11 s. |
| In the text | |
|
Fig. 3. Optical image of a ~8″ × 8″ region centered at the position of J1806–27 obtained with the planetary camera in the F555W filter. North is to the top, east to the left. The error region of the transient source J1806–27 derived from the Chandra data is overplotted; the inner and outer ellipses indicate the 68% and 99% uncertainty region, respectively (see text for more detail). The seven HST sources closest to the Chandra coordinates are indicated; their position in the color-magnitude diagram is shown in Fig. 4. |
| In the text | |
|
Fig. 4. Color-magnitude diagrams for the cluster NGC 6540. Magnitudes are in the AB system and are not corrected for reddening. Seven sources positionally consistent with the Chandra error ellipse of J1806–27 are indicated by the stars. |
| In the text | |
|
Fig. 5. Comparison of duration and luminosity of the flare from J1806–27 (black dot) with those of a sample of flares from chromospherically active stars (Tsuboi et al. 2016, and references therein). The error bar on the luminosity of J1806–27 is dominated by the uncertainty on the distance, for which we have assumed the range of values reported in the literature (3–5.3 kpc, see text). |
| In the text | |
Current usage metrics show cumulative count of Article Views (full-text article views including HTML views, PDF and ePub downloads, according to the available data) and Abstracts Views on Vision4Press platform.
Data correspond to usage on the plateform after 2015. The current usage metrics is available 48-96 hours after online publication and is updated daily on week days.
Initial download of the metrics may take a while.