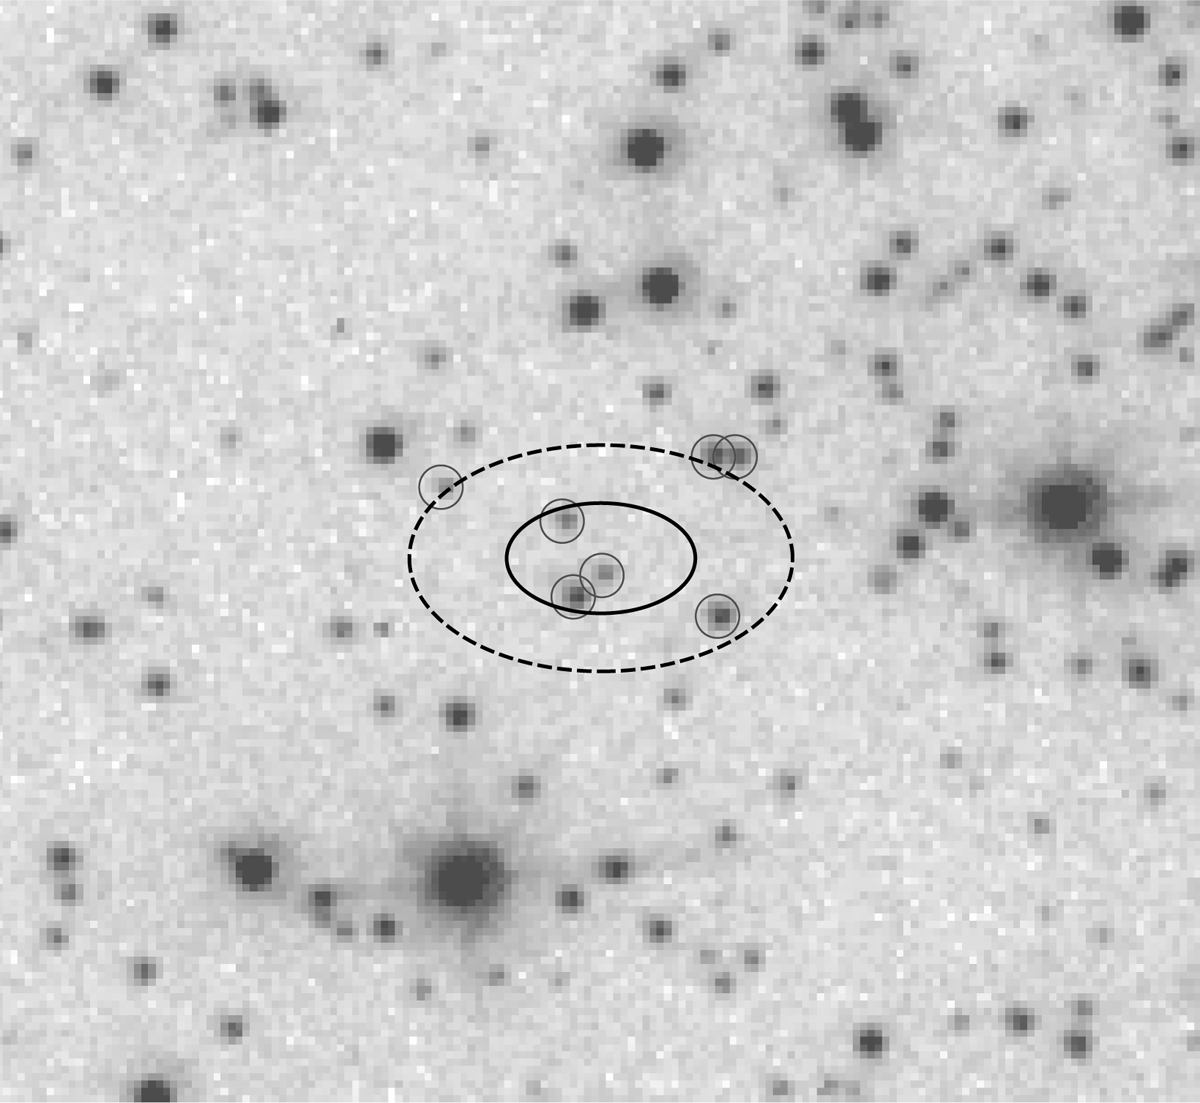
Fig. 3.

Optical image of a ~8″ × 8″ region centered at the position of J1806–27 obtained with the planetary camera in the F555W filter. North is to the top, east to the left. The error region of the transient source J1806–27 derived from the Chandra data is overplotted; the inner and outer ellipses indicate the 68% and 99% uncertainty region, respectively (see text for more detail). The seven HST sources closest to the Chandra coordinates are indicated; their position in the color-magnitude diagram is shown in Fig. 4.
Current usage metrics show cumulative count of Article Views (full-text article views including HTML views, PDF and ePub downloads, according to the available data) and Abstracts Views on Vision4Press platform.
Data correspond to usage on the plateform after 2015. The current usage metrics is available 48-96 hours after online publication and is updated daily on week days.
Initial download of the metrics may take a while.


