Fig. 3.
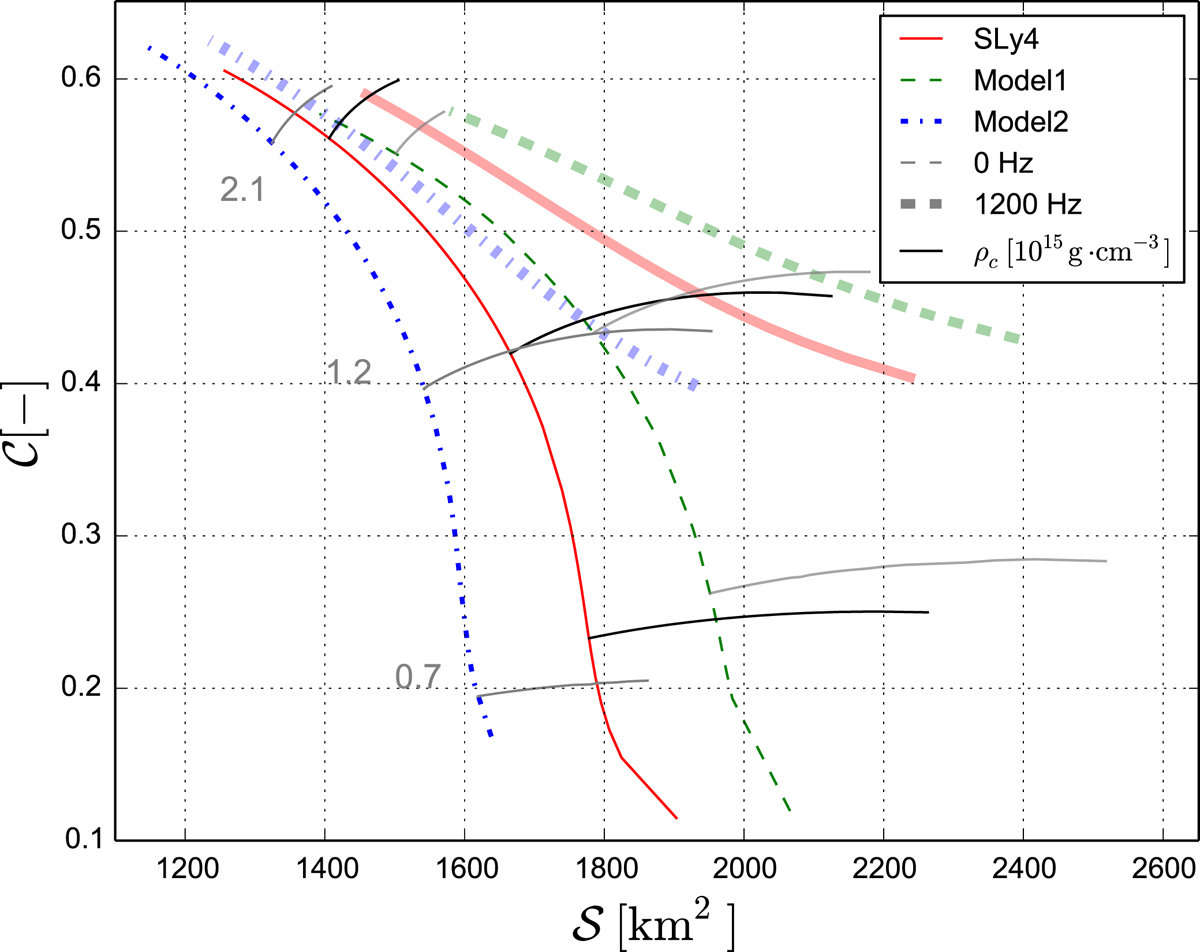
Compactness vs. surface area for three EOSs: SLy4 (solid red), Model1 (dashed green), and Model2 (dash-dotted blue), for two rotational frequencies: 0 Hz (thin lines) and 1200 Hz (thick lines). Lines of constant central density are indicated in grey (dark grey for SLy4, medium grey for Model2, and light grey for Model1). Corresponding values of the central density are given on the left side of the plot (in units of 1015g cm−3).
Current usage metrics show cumulative count of Article Views (full-text article views including HTML views, PDF and ePub downloads, according to the available data) and Abstracts Views on Vision4Press platform.
Data correspond to usage on the plateform after 2015. The current usage metrics is available 48-96 hours after online publication and is updated daily on week days.
Initial download of the metrics may take a while.