Fig. 8
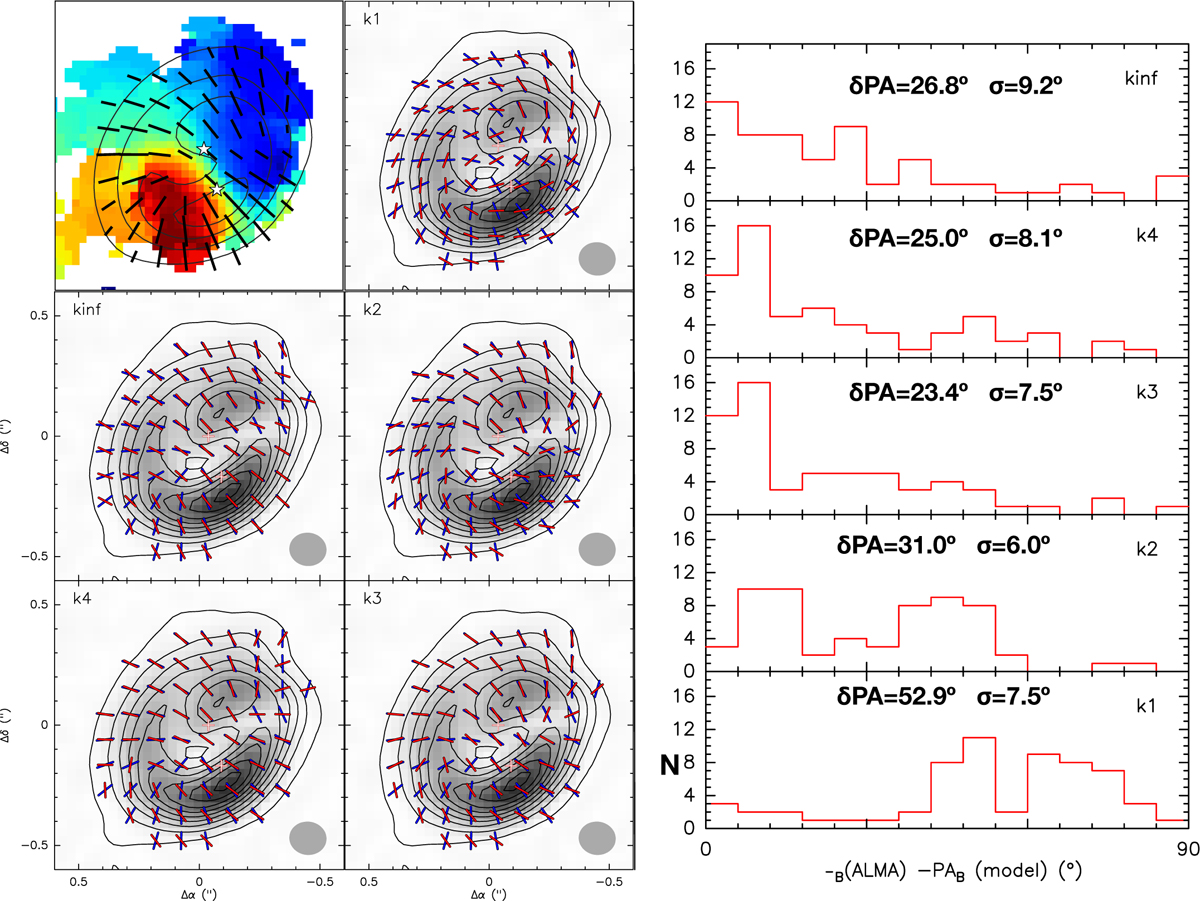
Left panels: synthetic magnetic field lines (red vectors) plotted on top of observed Band 7 Stokes I contours (5–45 mJy beam−1 in steps of 5 mJy beam−1), polarized intensity (grayscale with same intensity levels of Fig. 1), and magnetic fields (blue vectors, which are 90°-rotated with respect to Fig. 1). The red vectors result from our rotating disk modeling assuming different k = Bp ∕Bϕ values. Figure 6 is shown in the upper left panel for reference. Right panels: residuals from each case, with mean δPA = PAdata − PAmodel values and standard deviation σ indicated oneach histogram panel.
Current usage metrics show cumulative count of Article Views (full-text article views including HTML views, PDF and ePub downloads, according to the available data) and Abstracts Views on Vision4Press platform.
Data correspond to usage on the plateform after 2015. The current usage metrics is available 48-96 hours after online publication and is updated daily on week days.
Initial download of the metrics may take a while.