Fig. 6
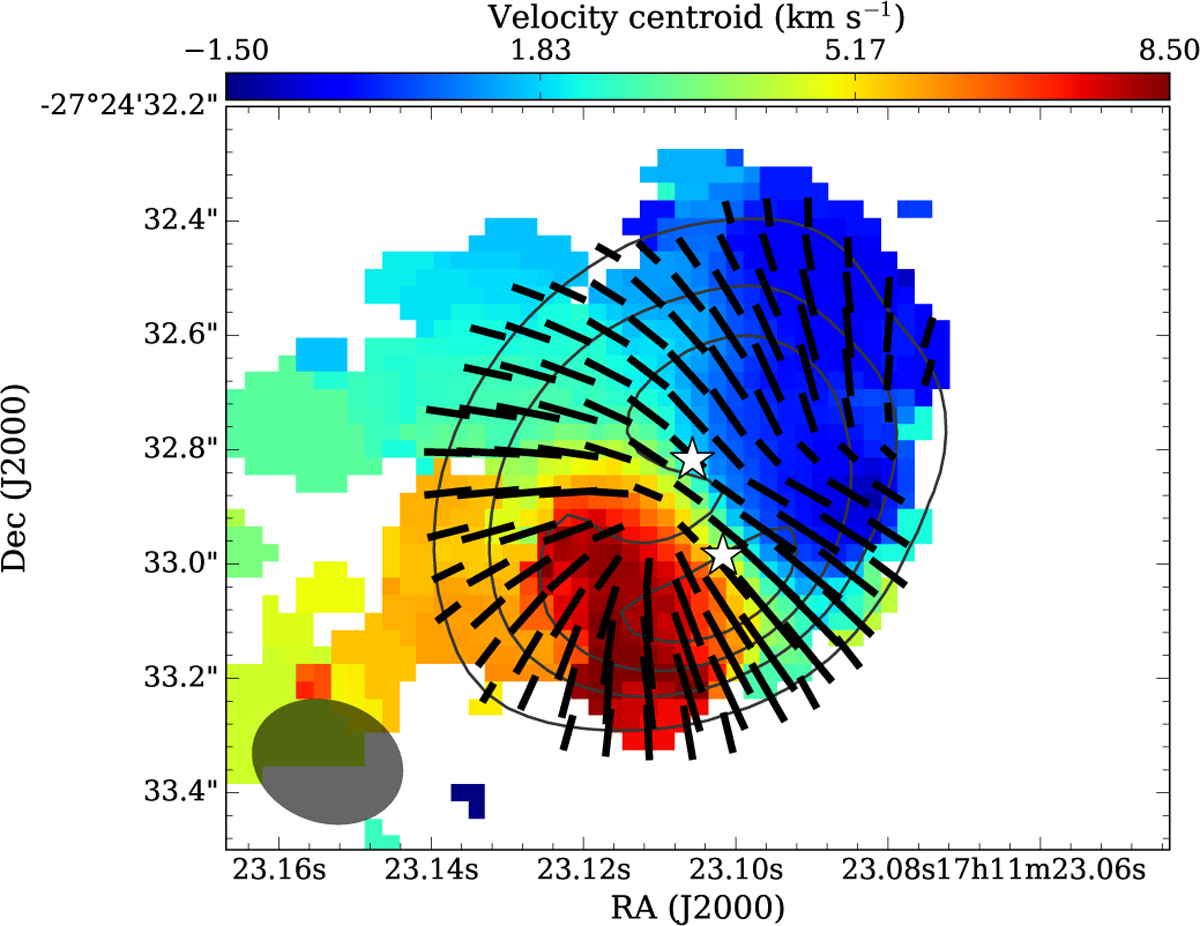
Polarization vectors rotated by 90° showing the plane-of-sky magnetic field configuration at Band 7. Contours show the same Stokes I intensity levels as in Fig. 1. The background image is a moment 1 map of the H2 CO (32,1 − 22,0) emission in BHB07-11. The moment map is produced from a 3σ cut (σ ~ 5.3 mJy beam−1) in the molecular emission. The synthesized beam of the H2CO map is 0.27′′ × 0.21′′. The stars symbols have the same meaning as in Fig. 1.
Current usage metrics show cumulative count of Article Views (full-text article views including HTML views, PDF and ePub downloads, according to the available data) and Abstracts Views on Vision4Press platform.
Data correspond to usage on the plateform after 2015. The current usage metrics is available 48-96 hours after online publication and is updated daily on week days.
Initial download of the metrics may take a while.