Free Access
Fig. 4
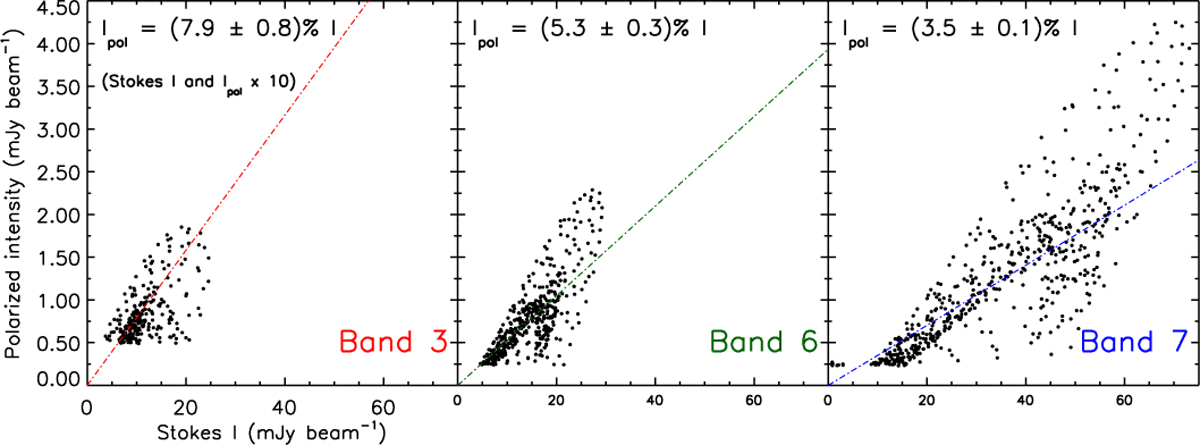
Distribution of the polarized intensity as a function of total intensity. The mean polarization fraction over the regions shown in the right panels of Fig. 1 are indicated in each panel as straight lines. The rms (error bars) for the polarized intensity and total intensity are mentioned in Sect. 2.1.
Current usage metrics show cumulative count of Article Views (full-text article views including HTML views, PDF and ePub downloads, according to the available data) and Abstracts Views on Vision4Press platform.
Data correspond to usage on the plateform after 2015. The current usage metrics is available 48-96 hours after online publication and is updated daily on week days.
Initial download of the metrics may take a while.