Fig. 1
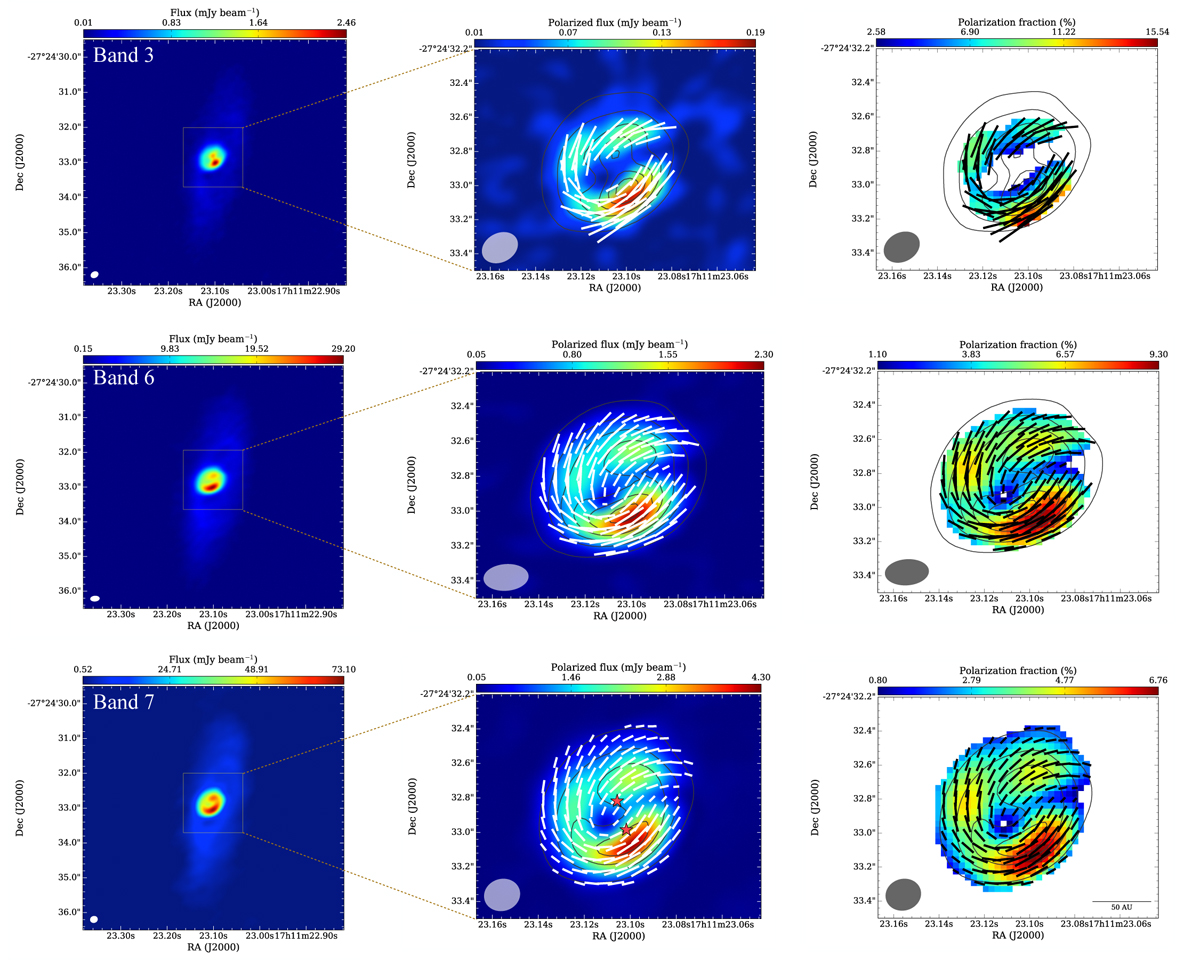
StokesI (left panel), polarized intensity (middle panel), and polarization fraction (right panel) of our Band 3 (upper panels), Band 6 (middle panels), and Band 7 (lower panels) ALMA data. The contours indicate the intensity levels of the Stokes I emission in each band, being 30, 60, 90, 120, 150, and 180 times the rms for bands of 3 and 6 (rmsBand 3 ~ 0.012 mJy beam−1 and rmsBand 6 ~ 0.15 mJy beam−1), and 30, 60, 90, 120 times 0.52 mJy beam−1, the rms for Band 7. The synthesized beams are 0.22′′ × 0.17′′ (position angle = −61.46°) for Band 3, 0.26′′ × 0.15′′ (position angle = −85.65°) for Band 6 and 0.21′′ × 0.18′′ (position angle = −72.79°) for Band 7. The vector map indicates the orientation of the polarization whose length is proportional to the polarization fraction. The vectors are sampled as one vector every two pixels. The two star symbols in the middle-lower panel indicate the position of the two continuum peaks detected in the 34 GHz VLA data, VLA 5a for the northern peak and VLA 5b for the southern one (see also Fig. 2).
Current usage metrics show cumulative count of Article Views (full-text article views including HTML views, PDF and ePub downloads, according to the available data) and Abstracts Views on Vision4Press platform.
Data correspond to usage on the plateform after 2015. The current usage metrics is available 48-96 hours after online publication and is updated daily on week days.
Initial download of the metrics may take a while.