Fig. A.1
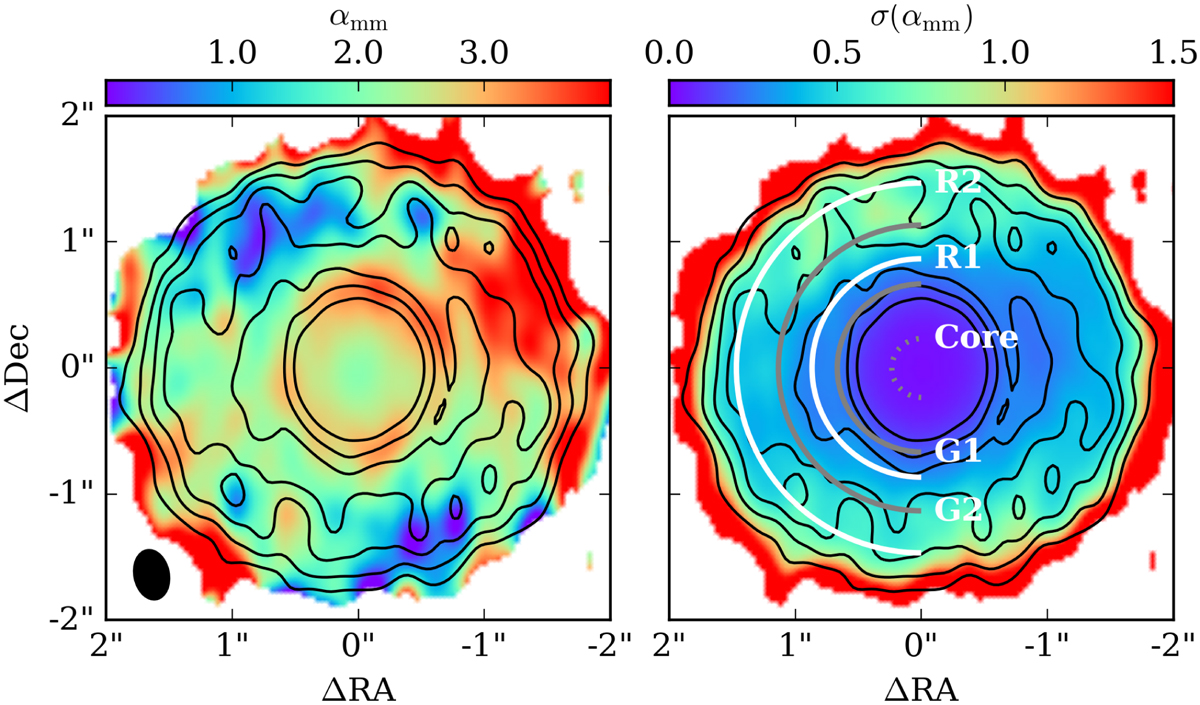
Leftpanel: αmm, deprojected and derotated. Right panel: standard error on αmm, not including the ± 0.42 offset due toflux calibration errors. The Band 6 data are overplotted in black, with contours at 3, 5, 7.5, 10, 15, 20, and 30σ. The locations of the rings (R1 and R2), gaps (G1 and G2), and the bright core are indicated with white and gray arcs.
Current usage metrics show cumulative count of Article Views (full-text article views including HTML views, PDF and ePub downloads, according to the available data) and Abstracts Views on Vision4Press platform.
Data correspond to usage on the plateform after 2015. The current usage metrics is available 48-96 hours after online publication and is updated daily on week days.
Initial download of the metrics may take a while.