Fig. 7
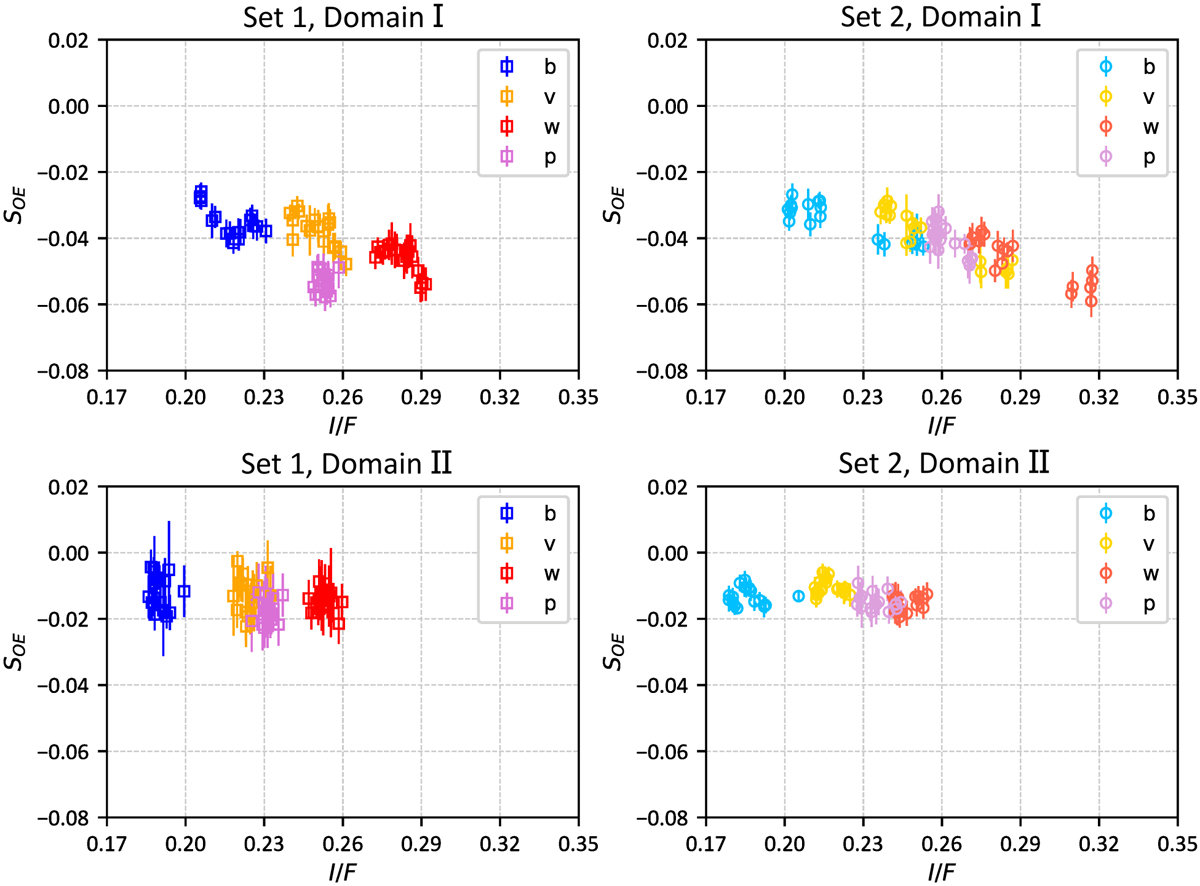
Slope parameter (SOE) based on manual extraction from image. The first column (top left and bottom left panels) is the relation between I∕F and SOE for Domain I, and the second column (top right and bottom right panels) is that for Domain II. I∕F is the representative value for an average of two images in each band and each set. Square symbols correspond to data from Set 1, while circles represent Set 2 data. Different colors coincide with the different bands of AMICA.
Current usage metrics show cumulative count of Article Views (full-text article views including HTML views, PDF and ePub downloads, according to the available data) and Abstracts Views on Vision4Press platform.
Data correspond to usage on the plateform after 2015. The current usage metrics is available 48-96 hours after online publication and is updated daily on week days.
Initial download of the metrics may take a while.