Fig. 6
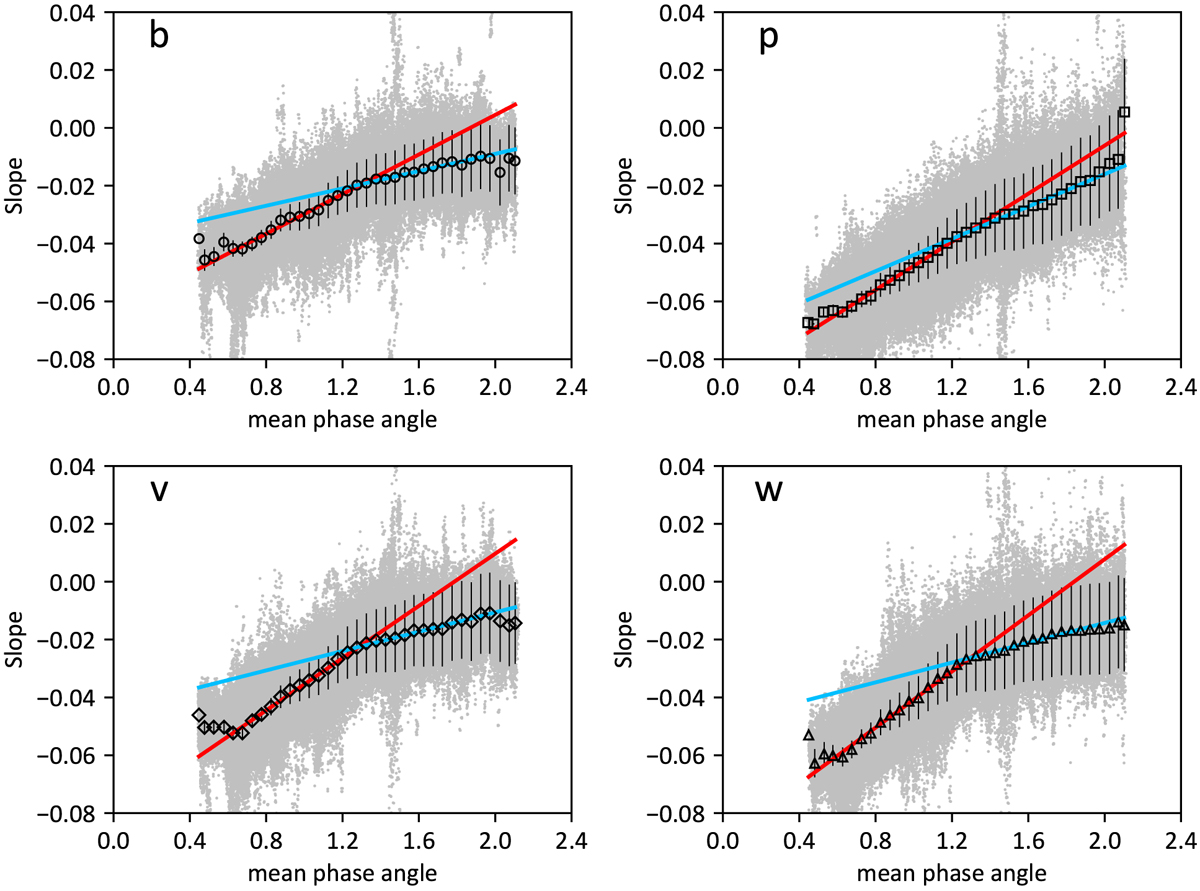
Opposition slope for Set 1 with respect to the mean phase angle. We adopted Criterion 3 (e.g., no i and e limitation). The wavelengths of the bands become longer counterclockwise from the top left. Gray dots present SOE for each pixel, and open circles with vertical error bars show the median values and the standard deviations of each pixel in the 0.°05 bin of the phase angle. We fit the median values at smaller and larger phase angles with lines (see the Sect. 3).
Current usage metrics show cumulative count of Article Views (full-text article views including HTML views, PDF and ePub downloads, according to the available data) and Abstracts Views on Vision4Press platform.
Data correspond to usage on the plateform after 2015. The current usage metrics is available 48-96 hours after online publication and is updated daily on week days.
Initial download of the metrics may take a while.