Fig. 5
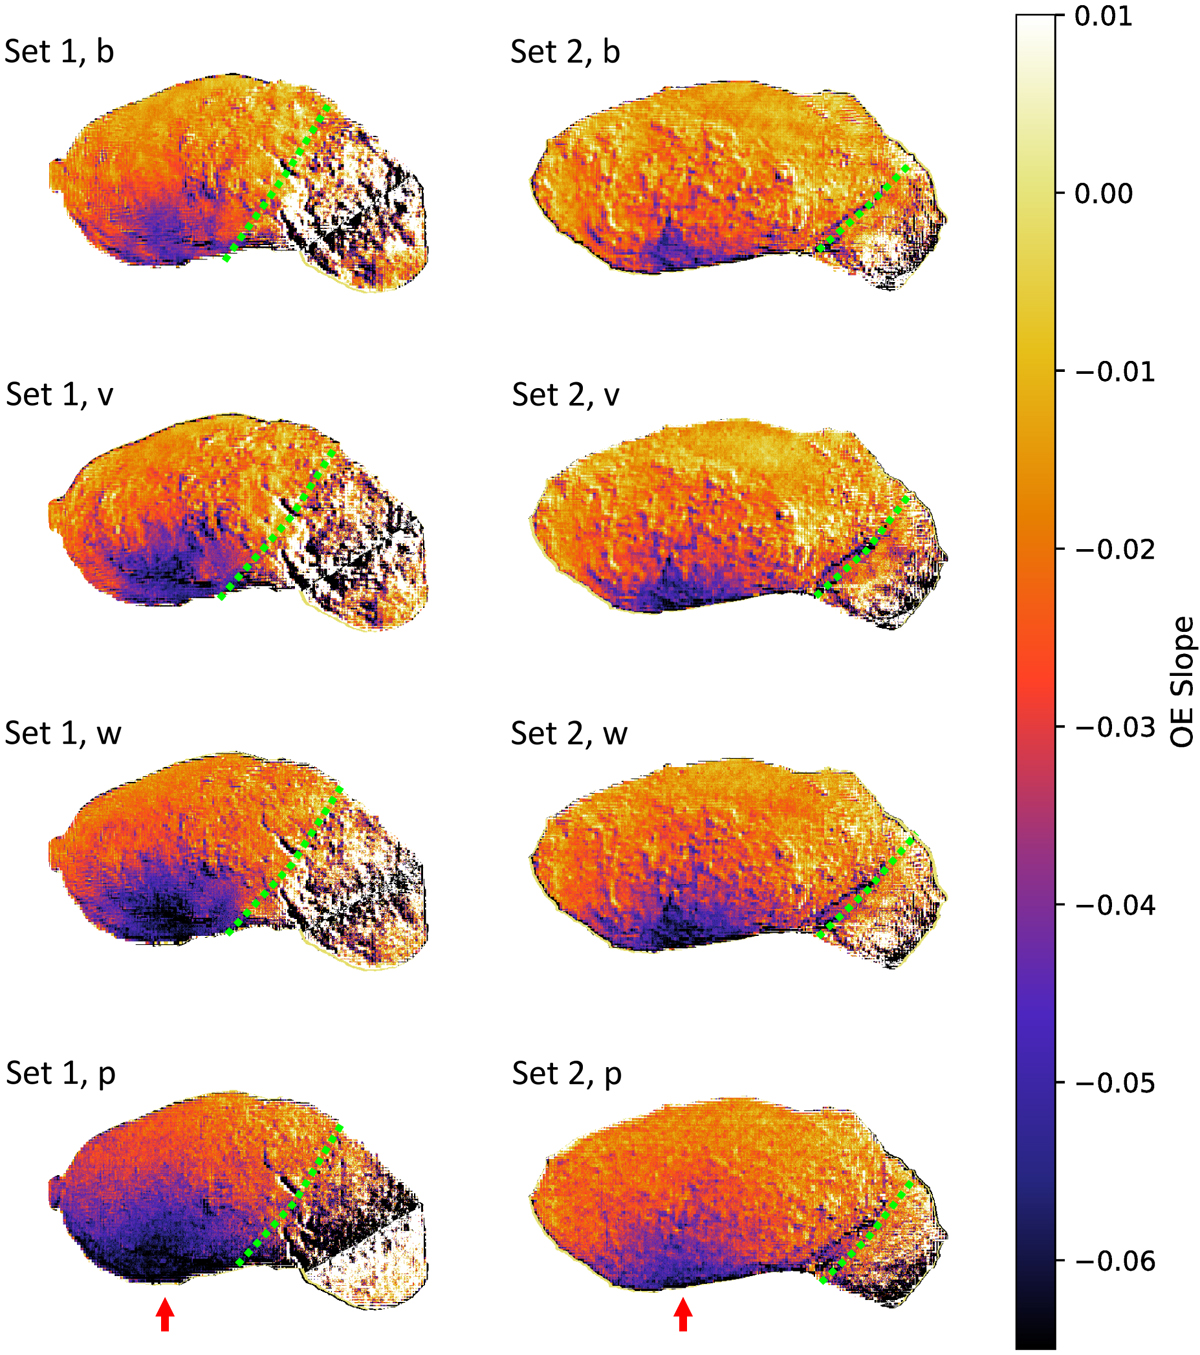
Maps of the slope parameter (SOE) for Set 1 (left panel) and Set 2 (right panel) at different wavelengths. The dark blue parts correspond to regions with steeper slope (i.e., smaller SOE), while the redparts represent a shallower slope (i.e., higher SOE). The opposition point is indicated by red arrows in the bottom panels. Green dashed lines separate regions where Δ α is >0.°3 (leftward) and <0.°3 (rightward), respectively, suggesting that the data to left side of the line satisfied Criterion 1 (see Sect. 2.2.5).
Current usage metrics show cumulative count of Article Views (full-text article views including HTML views, PDF and ePub downloads, according to the available data) and Abstracts Views on Vision4Press platform.
Data correspond to usage on the plateform after 2015. The current usage metrics is available 48-96 hours after online publication and is updated daily on week days.
Initial download of the metrics may take a while.