Free Access
Fig. 2.
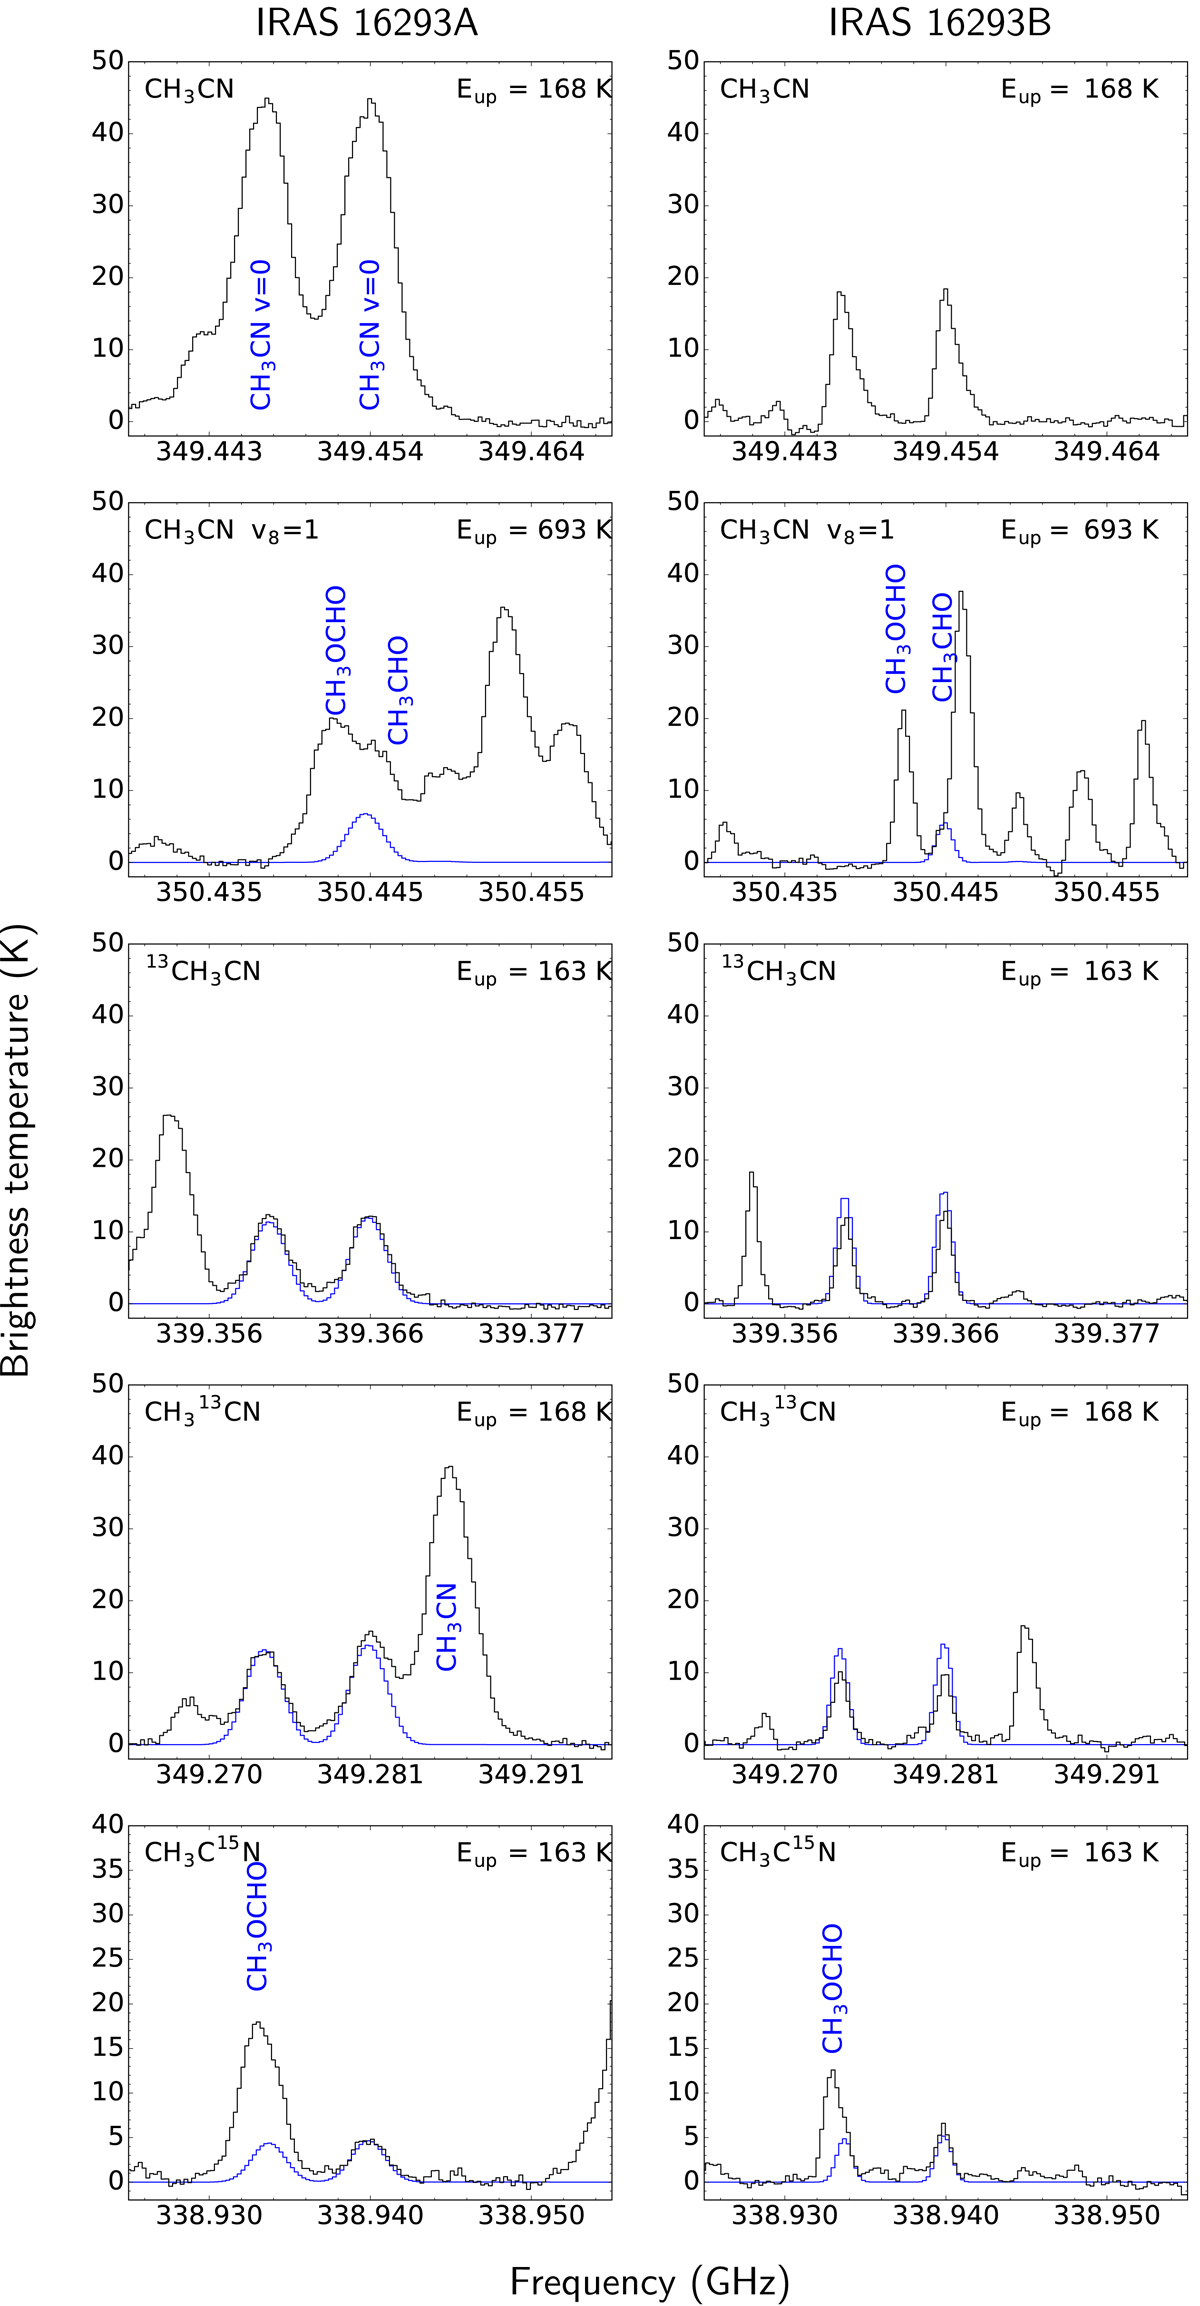
Spectra of the 190–180 line of CH3CN, CH3CN v8 = 1, 13CH3CN, CH3 13CN, and CH3C15N in sources A and B. An LTE model for each species is overlaid in blue except for CH3CN where the emission is optically thick and therefore a good fit cannot be found. Blended species are labelled in the figure.
Current usage metrics show cumulative count of Article Views (full-text article views including HTML views, PDF and ePub downloads, according to the available data) and Abstracts Views on Vision4Press platform.
Data correspond to usage on the plateform after 2015. The current usage metrics is available 48-96 hours after online publication and is updated daily on week days.
Initial download of the metrics may take a while.