Fig. 7.
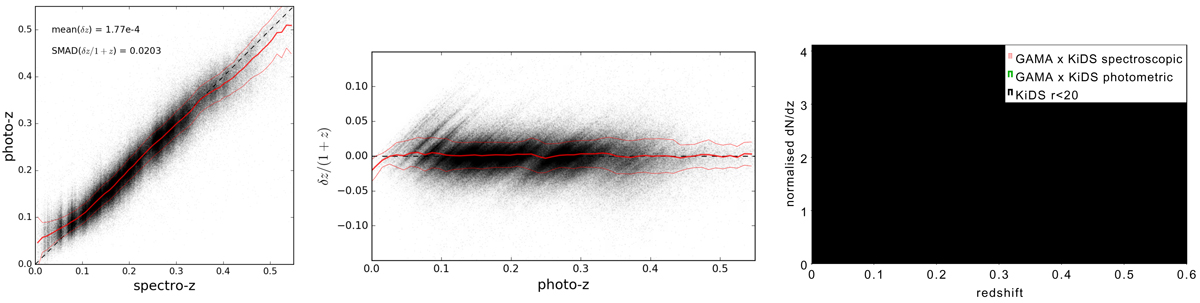
Performance of the KiDS-GAMA ANNz2 photo-zs as compared to the GAMA spectroscopic redshifts in the equatorial fields. Left- hand panel: direct spec-z–photo-z comparison; central panel: photo-z error as a function of photo-z; right-hand panel: comparison of redshift distributions for the same set of KiDS × GAMA sources (red bars for spec-zs, green line for photo-zs), with also dN/dzphot of the full bright-end KiDS sample (r < 20) overplotted (black line), all normalised to unit area under the histograms.
Current usage metrics show cumulative count of Article Views (full-text article views including HTML views, PDF and ePub downloads, according to the available data) and Abstracts Views on Vision4Press platform.
Data correspond to usage on the plateform after 2015. The current usage metrics is available 48-96 hours after online publication and is updated daily on week days.
Initial download of the metrics may take a while.