| Issue |
A&A
Volume 616, August 2018
|
|
|---|---|---|
| Article Number | A40 | |
| Number of page(s) | 10 | |
| Section | Galactic structure, stellar clusters and populations | |
| DOI | https://doi.org/10.1051/0004-6361/201731661 | |
| Published online | 13 August 2018 | |
A search for OB stars in the field of the galactic OB association Bochum 7
II. Proper motion and IR photometry⋆
1
Instituto Argentino de Radioastronomía (CCT-La Plata, CONICET; CICPBA), C.C. No. 5, 1894 Villa Elisa, Argentina
e-mail: This email address is being protected from spambots. You need JavaScript enabled to view it.
2
Facultad de Ciencias Astronómicas y Geofísicas, Universidad Nacional de La Plata, Paseo del Bosque s/n, 1900 La Plata, Argentina
3
Instituto de Astrofísica de La Plata, (CCT-La Plata, CONICET), Argentina
Received:
27
July
2017
Accepted:
19
April
2018
Abstract
Aims. We plan to identify the members of the Bochum 7 association by performing simultaneous astrometric and spectrophotometric analyses, and estimate its distance and evolutionary stage.
Methods. We used our own visual spectroscopic and UBV photometric data of a 30′ × 30′ region centered at = 8h44m47.2s, = −45°58′55.5″. This information enabled us to estimate the spectral classification and distance of all stars present in the region. The proper motion was analyzed with data of the UCAC 5 catalog and was used to identify the members of this association. We added JHK data from 2MASS and IRAS catalogs to check for the presence of infrared (IR) excess stars.
Results. We found that Bochum 7 is an OB association with at least 27 identified stellar members (l = 265°.12, b = − 2°) at a distance of ≃5640 pc. Its proper motion is μαcos δ = −4.92 ± 0.08 mas yr−1, μδ = 3.26 ± 0.08 mas yr−1. We derived an average heliocentric radial velocity of ~35 km s−1 and were able to confirm the binary nature of the (ALS 1135) system and detect four new binary star candidates. Analysis of data for massive Bo 7 star candidates points towards a young age (≤ 3 × 10⁶ years old) for the association, although the presence of a previous episode of star formation remains to be analyzed.
Key words: stars: early-type / proper motions / catalogs / open clusters and associations: individual: Bochum 7
Table 3 is only available at the CDS via anonymous ftp to cdsarc.u-strasbg.fr (130.79.128.5) or via http://cdsarc.u-strasbg.fr/viz-bin/qcat?J/A+A/616/A40
© ESO 2018
1. Introduction
The need for relevant statistics, such as the determination of large-scale galactic structure and the quantification of metallicity gradients on the disk require the knowledge of OB associations at distances of several kiloparsecs.
The study of associations located at distances greater than the kiloparsec becomes extremely complex and the use of a single research technique yields unreliable results with large uncertainties. Bochum 7 (Bo 7) is located in the region known as the “Puppis Window” in the third quadrant of our Galaxy. The low interstellar extinction in this region allows for reliable observational data to be obtained for stars that belong to the Perseus arm.
The available information can be summarized as follows:
-
Stephenson & Sanduleak (1971) published the Luminous Stars in the Southern Milky Way (ALS) catalog.
-
Moffat & Vogt (1975) performed a survey of open clusters with photoelectric photometry using the 61 cm telescope of the Bochum University at La Silla, Chile. They found that nine members of the ALS catalog possibly formed an association with
 and d̄ = 5.8 kpc.
 -
Stenholm (1984) evaluated existing data about Wolf-Rayet (WR) stars in OB associations and open clusters. They confirmed the membership of WR12 to Bochum 7, as originally proposed by Niemela (1982) and estimated a 30 pc diameter for the association.
-
Sung et al. (1999) used UBV and Hα photometry and located Bo 7 at a distance of 4.8 kpc near the center of the Vela OB1 stellar association (Reed 2000). They estimated the age of the association to be about 6 Myr old.
-
Dias et al. (2002) published the new catalog of optically visible open clusters and candidates. For this, they worked with the Tycho 2 data and presented 953 members of Bo 7 with μαcosδ = −0.05 mas yr−1 and μδ = 3.34 mas yr−1, although no detailed breakdown of the method was presented.
-
Arnal & Corti (2007) based on the analysis of the neutral hydrogen (HI) supershells carried out at the Southern Galactic Plane Survey (SGPS) proposed that the OB-association Bo 7 was born as a consequence of the evolution of GS263-02+45.
-
Corti et al. (2007, hereafter Paper I) performed the first spectroscopic analysis with the OB star candidates selected from UBV aperture photometry of the 30 arcmin field centered at α = 8h44m47.2s, δ = −45°58′55.5″(J2000.0).
-
Michalska et al. (2013) performed a photometric investigation focused on the binary system ALS 1135 and discovered 17 variable stars in the field of Vela OB1 or Bo 7 associations.
Stellar proper motions constitute a powerful tool for the identification of members of stellar groupings, open clusters, and OB associations (Dias et al. 2002; de Zeeuw et al. 1999 and references therein). It is therefore necessary to have stellar catalogs containing very good proper motions and covering a large extent of the celestial sphere down to faint magnitudes. The goal of this work is to increase our knowledge of the stellar components of Bo 7. For this, we now present an astrometric study that makes use of the UCAC 5 (Zacharias et al. 2017) catalog. With this survey we were able to derive the proper motion of stars located in the field of the Bochum 7 association. The combination of the astrometric results with the analysis shown in Paper I yield the astro-spectrophotometric members of the Bo 7 association, its distance, age, radial velocities, and so on. In this way, it is possible to increase our knowledge of the galactic region where the Bo 7 association is located.
The paper is organized as follows: Sect. 2 describes the available data and the analysis methods, results are shown in Sect. 3, and the discussion about global properties of the association and individual stars is developed in Sect. 4. Section 5 includes a brief summary of our findings. Additional material such as detailed information from radial velocity measurements for individual stars is included in Appendix A.
2. Observational data
2.1. Astrometric data
The astrometric data used in this paper, stellar position and proper motion, are extracted from the UCAC 5 catalog.
The UCAC 5 catalog presents the positions of over 180 million stars, and proper motions for 107.7 million of them. The UCAC 5 positions are on the Gaia DR1 (Gaia Collaboration et al. 2016a, b) reference system. The positions have mean epochs around 1998–2000 in the south, and around 2001–2003 in the north. Formal position errors are about 8 mas for stars with magnitude 11 and 20 mas at magnitude 14. The UCAC 5 catalog presents very precise proper motions combining UCAC 5 with Gaia DR1. Errors in proper motions of bright stars (R = 11–15 mag) lie between 1 and 2 mas yr−1 and can increase to 5 mas yr−1 for the fainter stars.
A detailed description about the construction of the UCAC 5 catalog can be found in Zacharias et al. (2017). Data extraction was performed using the SIMBAD Astronomical Database (CDS).
2.2. Photometric and spectroscopic data
The UBV photometric data analyzed by us in order to investigate the OB association Bo 7 are those presented in Sects. 2 and 3.1 of Paper I. We selected stars with V < 15 mag and reddening−free parameter Q < −0.3 (Schmidt-Kaler 1982) in the 30′ × 30′ photometric image centered at ≃ α = 8h45m, δ = −45°59′ (l = 265°.12, b = −2°.0) and found 248 probable members of this association (see Table 3). The photometric study was complemented with JHK data from the Two Micron All Sky Survey (2MASS; Skrutskie et al. 2003).
We also investigate the IRAS point sources present in the region under study consulting the Gator Catalog Query1 in the IRAS Point Source Catalog v2.1 (PSC) section.
Spectral images data studied in this work are those presented in Sect. 3.2.1 of Paper I.
3. Results
3.1. First astrometric analysis
Although impossible to detect by visual inspection of direct imaging, the existence of an association can be inferred from their proper motions, through the analysis of the Vector Point Diagram (VPD). In this diagram the relatively small differences of the velocities of individual stars from the association can be detected as an over-density. As a first step, we identified in UCAC 5 catalog the 219 stars out of the 248 candidates proposed as members of Bo 7 (Table 3). For its identification, the astrometric catalog UCAC4 was used as an intermediate catalog in the following way. From the 248 early-type stars present in the field of view of Bo 7, 226 were identified in UCAC4 from position (α, δ) and magnitudes (V, B). From the UCAC4 sample, 219 were further identified in the UCAC5 from position (α, δ) and 2MASS magnitudes (J, H, K). Subsequently we analyzed the presence of an over-density with the model proposed by Orellana et al. (2010). In their paper, they suggested for the first time, a standardized way to identify the members of an association. To do this, the authors applied the same technique used for open clusters considering only the proper motions based upon the maximum likelihood principle (Sanders 1971).
The distribution of the proper motions will be the overlapping area of two bivariate normal frequency functions in an elliptical subregion of the VPD selected as indicated by Vasilevskis et al. (1965);
 (1)
(1)
where ø1i is a circular distribution for cluster stars and ø2i is an elliptical distribution for field stars. The circular and elliptical distributions take the following form:
 (2)
(2)
and
 (3)
(3)
where the symbols σxf, σyf are the elliptical dispersions for the field stars, σa the circular dispersion for the association stars, μxf, μyf the field star mean proper motion, and μxa, μya the association mean proper motion. Na is the number of association members, and Nf the number of field stars. These parameters are found by applying the maximum likelihood principle. Once determined, the probability for the ith star was calculated as
 (4)
(4)
A cluster member is found when Pi ≥ 0.5.
In this procedure we do not consider the influence of proper motion errors. Chen et al. (1997) and Orellana et al. (2015) show that the error does not change the parameters significantly and more than 80% of the members maintain their condition.
The astrometric study begins by applying the maximum likelihood method to an elliptical subregion of the VPD containing 186 stars (Fig. 2a). The parameters of the stars with similar proper motions obtained from this method are Na = 123, μxa = −5.42 ± 0.06 mas yr−1, μya = 3.63 ± 0.06 mas yr−1, σa = 0.74 ± 0.05 mas yr−1. Figures 1a and 2b show the location of the 123 stars in the spatial distribution and in the VPD, respectively, with open circles around the dots. In order to identify the member stars of Bo 7, we analyzed the distance modulus (DM) of the 123 possible members.
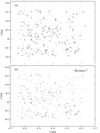 |
Fig. 1. Spatial distribution of the stellar association. Panel a: open circles around the dots represent the 123 stars with similar proper motions identified in the first analysis; the points represent the rest of the stars of the region; a total of 219 stars. Panel b: open circles represent the 27 astrometric and spectrophotometric Bo 7 association members. All of them were derived using the model proposed by Orellana et al. (2010). |
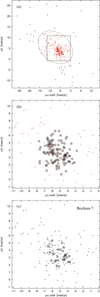 |
Fig. 2. VPD of the stellar association consulting the UCAC5 catalog. Panel a: maximum likelihood method assigns the Gaussian distribution bivariate elliptic to the 186 field stars. Points outside ellipse represent the rest of the region’s stars in the first analysis. Panel b: a zoom image of the square indicated in panel a. Open circles around the dots represent the 123 astrometric members that the maximum likelihood method assigns the Gaussian circular distribution bivariate. Panel c: open circles represent the 27 astrometric and spectrophotometric association Bo 7 members. All of them were obtained using the model proposed by Orellana et al. (2010). |
3.2. Spectral types and distances
The spectral classification of stars in this study were obtained in Paper I and are listed in Table 2.
In this paper, the DM of each star was obtained using Eq. (4) of Paper I. The intrinsic (B − V)0 color index and AV visual extinction were calculated from our observational data with Eqs. (5) and (6), respectively. The latter were obtained from Schmidt-Kaler (1982), together with the absolute visual magnitude of each star according to its spectral type.
 (5)
(5)
 (6)
(6)
For stars with two different spectral types, we calculated the average value of Mv and interpolated linearly whenever needed. The error in the determination of the distance to each star was found to be around 30%. We obtained that value with errors propagation. For this, we considered average magnitude errors of 0.08 in V, 0.10 in B, and 0.18 in U (Paper I) and an uncertainty of 0.5 in the estimation of Mυ (Walborn 1972). Although errors in individual distances derived from spectroscopic classification are large, they can still provide a first-order estimation useful for removing foreground and background stars. We finally chose to consider possible members of the Bo 7 association to those stars whose distance matched with the average distance ( = 13.725) obtained from the subset of ALS stars listed as Bo 7’s members by Moffat & Vogt (1975), accounting for an uncertainty of 0.5 mag. In this way, were considered 26 stars with 13.475 ≤ DM ≤ 13.975 resulting from the first astrometric analysis as probable members of Bo 7. We also included the binary system ALS 1135 even though its photometric distance (DM = 14.1) is slightly off the range as binary pairs have larger uncertainties in their photometric distance determinations. The results obtained in the calculation of DM are shown in Table 2. The DM obtained for stars in common with Paper I are in very good agreement.
3.3. Final astrometric analysis and association distances
In order to improve the identification of the members of Bo 7, the maximum likelihood method was applied to a group of stars selected from the 186 stars of the elliptical subregion and DM analysis as follows.
We removed the contamination produced by 94 stars located in the foreground and background of the Bo 7 sample, that is, those with DM in the ranges 13.475 > DM > 13.975 obtained following the procedure outlined in Sect. 3.2. The Orellana et al. (2010) model was applied again to these 92 stars (186 (stars of the elliptical subregion) − 94 (stars outside the Bo 7 bin)) and the refined parameters found were Na = 27, μxa = −4.92 ± 0.08 mas yr−1, μya = 3.26 ± 0.08 mas yr−1, σa = 0.42±0.07 mas yr−1. In this case, 27 stars were identified as likely candidates to be members of Bo 7. Figures 1b and 2c show their spatial distribution and VPD, respectively. Table 1 lists the stars found with this procedure.
Possible astrophotometric members of Bo 7.
After combining membership by proper motions and distances via spectrophotometry, the distance moduli of the Bo 7 association is found to be 13.7 ± 0.2 (5.6 ± 1.7 kpc).
3.4. Stellar radial velocities
The radial velocity is another important parameter to be studied for each star member of the association. We gathered radial velocity determinations for 15 stars in the Bo 7 association (Column 9 of Table 2). A detailed breakdown of individual measurements can be found in Appendix A.
Spectrophotometric information of stars in Bo 7, including distance modulus determination and measured radial velocities.
A single determination of radial velocities of massive stars must be handled with care and the uncertainties in individual distances are large. Similarly, we perform an individual check on their velocities and those expected according to the Milky Way rotation.
Figure 3 shows the LSR radial velocity, RVLSR, and the distance from each star to the Sun; both parameters are included with their respective error bars. The fit of the Galactic rotation curve model by Brand & Blitz (1993) applied to the third quadrant of the Galaxy (see Sano et al. 2017) is also plotted as a reference, although the uncertainties in the model determination at about 10 kpc from the Galactic Centre are large. Large uncertainties involved in the individual parameters are reflected in the observed scatter, and only star #4288 is located farther than expected for its errors. Appendix A includes two radial velocity determinations with similar low values, making it the strongest candidate to be checked for RV anomalies in the future with higher-resolution spectra.
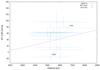 |
Fig. 3. LSR corrected radial velocity vs. distance of Bo 7 member candidates plotted as blue crosses with their corresponding error bars. The pink curve displays the fit of the galactic rotation model applied to the third quadrant of our Galaxy (Brand & Blitz 1993). Star #4288 is the only member more than 3σ away from its expected location (discussed further below). As a reference, star #3705 is the ALS 1135 binary system. |
The galactic rotation model (Fig. 3) indicates that at a distance to the Sun of ~5.7 kpc (~13.7 mag) the Local Standard of Rest radial velocity (VLSR) value is ~40 km s−1 (Vhe ≃ 35 km s−1). This is in good agreement with the radial velocity values with their errors shown for Bo 7 members in Table 2.
4. Discussion
4.1. Recent membership identifications.
Michalska et al. (2013) performed a photometric and spectroscopic investigation focused on the ALS 1135 binary system and presented a photometric analysis of the surrounding region. They built a VI color magnitude diagram and used additional information from spectroscopic classification found in the literature and variable stars identified from their photometry to identify six stars in this region as possible Bo 7 members. Five of these stars are included in the present work and we agree on member candidacy for stars #3705 (ALS 1135), #3669 (ALS 1137) and #3829 (CBN 84344.7-460656), although we reject CBN 84348.6-460736 and CBN 84346.7-460641, which, according to our astrometric and spectrophotometric study, would not be identified as Bo 7 members in terms of their distances.
4.2. Size and evolutionary age
Defining the boundary of the association is a nontrivial issue. The lack of a visible concentration of stars among the background forces us to distinguish this group kinematically, but although proper motion surveys are available, it is not possible to derive radial velocities for all the stars. Furthermore, chances of massive stars being part of a multiple system are high (Bosch et al. 2009), but it is difficult to confirm whether or not a star belongs to a multiple system when there are only a few spectra available for it.
As was explained in Sect. 3.1, with data of proper motion it is possible to make a first selection of association members, however with these data alone we cannot define the size of them. With a distance of ≃5640 pc adopted for the Bo 7 association, our field of view limits the surveyed area to a 50 pc-wide region. This size corresponds to the typical sizes of the stellar associations (Efremov et al. 1987) although it is somewhat larger than the diameter of 30 pc found by Stenholm (1984). This association is projected onto the outer border of the HI supershell GS 263 − 02 + 45 (Arnal & Corti 2007). Both objects have similar distances and radial velocities, so it is possible that a physical link between them is present.
By combining the photometric and spectroscopic information on member candidates, we can decipher the evolutionary stages of the association. Figure 4 presents the color-magnitude diagram (CMD) of Bo 7. This figure shows the intrinsic visual magnitude and the intrinsic color index of each star and stars are labeled according to their luminosity class. The theoretical isochrones for solar metallicity, mass loss, and overshooting (Marigo & Girardi 2008) are also plotted as a reference. Figure 4 shows that main sequence (MS) and giant stars occupy a particular region of the CMD, with an unavoidable scatter, possibly due to stars from different formation events that belong to multiple systems, stars with emission lines, or fast rotators. As we are dealing with an incomplete sample of the association, we do not have enough stars to attempt a precise fitting of isochrones in order to discriminate different populations among them. However, it is evident that almost all massive stars lie close to the 3 × 10⁶ year-old isochrone, pointing towards very recent episode(s) of star formation, younger than 1 × 10⁷ years old. The presence of WR12, a Wolf-Rayet star in the field, can also be linked to recent massive star formation and was the key driver of the original spectrophotometric study. The spectral classification of WR12 (WN8h), which has been identified as a single spectrum spectroscopic binary, suggests an evolutionary age of 3.5 × 10⁶ years (Smith & Conti 2008). van der Hucht (2001) estimates a distance of 5 kpc based on photometric data and an absolute magnitude Mv of −5.48. However, we must always keep in mind that magnitudes of WR stars are very uncertain. The very well studied star GR290 (Polcaro et al. 2016) presents a visual magnitude that ranges from 18.3 to 18.7 in its WN8h phase. Regarding its proper motion, WR12 has a μαcosδ of −4.4 mas yr−1 and μδ of 2.8 mas yr−1, coincident with the proper motion values of the Bo 7 members.
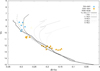 |
Fig. 4. CMD of member stars of Bo 7. The MS stars among O6.5 and B0 are identified with light blue triangles, the MS stars among B1 and B6 are identified with yellow triangles, and the luminosity class-III stars among B0 and B2 are identified with yellow open triangles. The thicker continuous curve is the Schmidt-Kaler (1982) HR diagram for early stars; the other curves are Marigo & Girardi (2008) isochrones for z = 0.02. All the reference curves are corrected by an apparent distance modulus of 13.7. |
Figure 5 shows the spatial distribution of the Bo 7 members, split into three groups according to their spectral types. One group includes the MS stars between O 6.5 and B 0 type (light blue triangles) which can be linked to the most recent and massive formation episode. The other group includes the MS stars from B 1 to B 6 (yellow triangles), and the last group includes the giant stars from B 0 to B 2 (yellow open triangles) encompassing evolved and less massive stars. The young and massive group seems more concentrated towards the southwestern region of the surveyed area. Furthermore, in the southern edge, we can identify the infrared (IR) source IRAS 08426-4601 mentioned in Sect. 2.2, which can be associated with ongoing star formation in that area. The relatively older and less massive population is more evenly spread throughout the field covered by our photometry. This scenario, where different evolutionary stages seem to occupy different areas, can be interpreted as a trace of sequential star formation, but as stated by Fariña et al. (2009) when discussing the N159/160 region of the LMC, a detailed and more complete study is needed before any robust conclusions can be made. Furthermore, it is worth recalling the possible scenario described by Bastian (2011) where stars could be formed in loose filamentary groups and then disperse in the background without the need of a large cluster with subsequent gas expulsion.
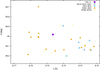 |
Fig. 5. Spatial distribution of the Bo 7 members. The WR12 star is identified with a large lilac dot and the IRAS source is identified with a green asterisk. The other symbols are the same as those in Fig. 4. |
4.3. Infrared photometry
The near-IR two-color diagram is a good tool for the selection of IR-excess stars. Figure 6 is the JHK color-color diagram obtained with 2MASS photometric data for member stars of the Bo 7 association; the black and lilac solid curves are the unreddened and shifted curves, respectively. The lilac solid curve has been shifted according to the color excess MS stars (Koornneef 1983). The color excesses were obtained using the Rieke & Lebofsky (1985) equations, knowing that the E(B − V) is 0.77 mag for Bo 7. The dashed lines indicate the normal reddening path (Rieke & Lebofsky 1985). Next to the symbols, we show the stellar identification number from this paper (see Table 2).
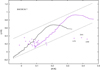 |
Fig. 6. Photometric diagrams for star members of Bo 7. Dashed lines indicate the normal reddening path (Rieke & Lebofsky 1985). The black and lilac solid curves are the unreddened and shifted curves, respectively. The lilac solid curve has been shifted according to the color excess MS (Koornneef 1983). |
The error of ≃0.02 mag in the JHK star colors observed with 2MASS telescopes is likely the reason why some stars are so widely distributed around the MS curve. Bochum 7 has the stars #1470, #2041 and #4288 that lie to the right of the normal reddening vector of an OB dwarf star. This apparent IR excess can be linked to the presence of current star formation in dusty disks or emission lines that enhance the observed K-band flux. Our optical spectra reveal that all these stars show emission lines (the star #1470 is classified as B0 IIIe, #2041 as WN8 and #4288 as B1-2Ve) which can be responsible for the shift to the right in their (J-H) versus (H-K) diagram.
The IRAS source 8426-4601 (l, b) = (265°.3, −2°.2) is found in the vicinity of Bo 7. In the survey of the CS (2-1) emission toward IRAS point sources in the galactic plane (Bronfman et al. 1996) this IRAS source shows an emission line at radial velocity V = 43.8 km s−1. The color-color diagram obtained from the fluxes measured in the IR (Wood & Churchwell 1989) indicates that it could be an ultra-compact HII region. Molecular observations of different CO emission lines obtained with MOPRA2 and APEX3 radio telescopes are currently being analyzed. The main objective of these observations is to characterize the molecular cloud physics associated with the source IRAS 8426-4601 and Bo 7 (paper in prep.).
5. Summary
Since the discovery of the Bo 7 stellar group by Moffat & Vogt (1975), several studies have been carried out to identify its members in the region using spectroscopic, photometric, and astrometric analysis techniques. This paper is the result of the first investigation carried out in the Bo 7 region employing these astrophysics techniques simultaneously. With these techniques we confirmed that Bo 7 is an OB association centered at α = 8h45m, δ = −45°59′ (l = 265°.12, b = −2°.0) at a distance of ≃5.7 kpc and identified 27 stellar members. The components of the proper motion are μαcosδ = −4.92 ± 0.08 mas yr−1, μδ = 3.26 ± 0.08 mas yr−1. Bochum 7 is located on the edge of the HI supershell GS 263 − 02 + 45 (Arnal & Corti 2007) and perhaps the birth of the Bo 7 association may be related to the evolution of this HI supershell. Our results suggest that Bochum 7 has a heliocentric radial velocity of ~35 km s−1 (VLSR = 40 km s−1 for d = 5.7 kpc, Fig. 3), and binary system has been confirmed (ALS 1135, Corti et al. 2003) as well as another four stars with variable radial velocities, thus making them binary-system candidates.
Acknowledgments
This work was partially supported by Universidad Nacional de La Plata (UNLP) under projects 11/G144. This publication also made use of data from the Two Micron All Sky Survey, which is a joint project of the University of Massachusetts and the Infrared Processing and Analysis Center/California Institute of Technology, funded by the National Aeronautics and Space Administration and the National Science Foundation (http://cdsportal.u-strasbg.fr/). This work has made use of data from the European Space Agency (ESA) mission Gaia (https://www.cosmos.esa.int/gaia), processed by the Gaia Data Processing and Analysis Consortium (DPAC, https://www.cosmos.esa.int/web/gaia/dpac/consortium). Funding for the DPAC has been provided by national institutions, in particular the institutions participating in the Gaia Multilateral Agreement. We thank Jorge Panei for many useful comments which improved this paper. Finally, we wish to thank the anonymous referee for their suggestions and comments, which improved the original version of this work.
Visiting Astronomer, Complejo Astronómico El Leoncito operated under agreement between the Consejo Nacional de Investigaciones Científicas y Técnicas de la República Argentina and the National Universities of La Plata, Córdoba and San Juan.
References
- Arnal, E. M., & Corti, M. 2007, A&A, 476, 255 [NASA ADS] [CrossRef] [EDP Sciences] [Google Scholar]
- Bagnuolo, W. G., Jr., Gies, D. R., Riddle, R., & Penny, L. R. 1999, ApJ, 527, 353 [NASA ADS] [CrossRef] [Google Scholar]
- Bastian, N. 2011, in Stellar Clusters and Associations: A RIA Workshop on Gaia, 85 [Google Scholar]
- Bosch, G., Terlevich, E., & Terlevich, R. 2009, AJ, 137, 3437 [NASA ADS] [CrossRef] [Google Scholar]
- Brand, J., & Blitz, L. 1993, A&A, 275, 67 [NASA ADS] [Google Scholar]
- Bronfman, L., Nyman, L.-A., & May, J. 1996, A&AS, 115, 81 [NASA ADS] [Google Scholar]
- Chen, B., Asiain, R., Figueras, F., & Torra, J. 1997, A&A, 318, 29 [NASA ADS] [Google Scholar]
- Corti, M., Niemela, V., & Morrell, N. 2003, A&A, 405, 571 [NASA ADS] [CrossRef] [EDP Sciences] [Google Scholar]
- Corti, M., Bosch, G., & Niemela, V. 2007, A&A, 467, 137 [NASA ADS] [CrossRef] [EDP Sciences] [Google Scholar]
- de Zeeuw, P. T., Hoogerwerf, R., de Bruijne, J. H. J., Brown, A. G. A., & Blaauw, A. 1999, AJ, 117, 354 [NASA ADS] [CrossRef] [Google Scholar]
- Dias, W. S., Alessi, B. S., Moitinho, A., & Lépine, J. R. D. 2002, A&A, 389, 871 [NASA ADS] [CrossRef] [EDP Sciences] [Google Scholar]
- Efremov, I. N., Ivanov, G. R., & Nikolov, N. S. 1987, Ap&SS, 135, 119 [NASA ADS] [CrossRef] [Google Scholar]
- Fariña, C., Bosch, G. L., Morrell, N. I., Barbá, R. H., & Walborn, N. R. 2009, AJ, 138, 510 [NASA ADS] [CrossRef] [Google Scholar]
- Fernández Lajús, E., & Niemela, V. S. 2006, MNRAS, 367, 1709 [NASA ADS] [CrossRef] [Google Scholar]
- Gaia Collaboration (Brown, A. G. A., et al.) 2016a, A&A, 595, A2 [NASA ADS] [CrossRef] [EDP Sciences] [Google Scholar]
- Gaia Collaboration (Prusti, T., et al.) 2016b, A&A, 595, A1 [NASA ADS] [CrossRef] [EDP Sciences] [Google Scholar]
- Koornneef, J. 1983, A&A, 128, 84 [NASA ADS] [Google Scholar]
- Marigo, P., Girardi, L., Bressan, A., et al. 2008, A&A, 482, 883 [NASA ADS] [CrossRef] [EDP Sciences] [Google Scholar]
- Michalska, G., Niemczura, E., Pigulski, A., Steślicki, M., & Williams, A. 2013, MNRAS, 429, 1354 [NASA ADS] [CrossRef] [Google Scholar]
- Moffat, A. F. J., & Vogt, N. 1975, A&AS, 20, 85 [NASA ADS] [Google Scholar]
- Niemela, V. S. 1982, in Wolf-Rayet Stars: Observations, Physics, Evolution, eds. C. de Loore, & A. J. Willis (Dordrecht: Reidel), Proc. IAU Sump., 99 [Google Scholar]
- Orellana, R. B., de Biasi, M. S., Bustos Fierro, I. H., & Calderón, J. H. 2010, A&A, 521, A39 [NASA ADS] [CrossRef] [EDP Sciences] [Google Scholar]
- Orellana, R. B., De Biasi, M. S., Paíz, L. G., Bustos Fierro, I. H., & Calderón, J. H. 2015, New Astron. Rev., 36, 70 [CrossRef] [Google Scholar]
- Polcaro, V. F., Maryeva, O., Nesci, R., et al. 2016, AJ, 151, 149 [NASA ADS] [CrossRef] [Google Scholar]
- Reed, B. C. 2000, AJ, 119, 1855 [NASA ADS] [CrossRef] [Google Scholar]
- Rieke, G. H., & Lebofsky, M. J. 1985, ApJ, 288, 618 [NASA ADS] [CrossRef] [Google Scholar]
- Sanders, W. L. 1971, A&A, 14, 226 [NASA ADS] [Google Scholar]
- Sano, H., Reynoso, E. M., Mitsuishi, I., et al. 2017, J. High Energy Astrophys., 15, 1 [NASA ADS] [CrossRef] [Google Scholar]
- Schmidt-Kaler, Th. 1982, Landolt-Bornstein New Series, Group VI, Vol. 2b, eds. T. Schmidt-Kaler, & H. H. Voigt (Berlin: Springer-Verlag) [Google Scholar]
- Skrutskie, M. F., Cutri, R. M., Stiening, R., et al. 2003, VizieR Online Data Catalog: VII/233 [Google Scholar]
- Smith, N., & Conti, P. S. 2008, ApJ, 679, 1467 [NASA ADS] [CrossRef] [Google Scholar]
- Stenholm, L. 1984, A&AS, 58, 163 [NASA ADS] [Google Scholar]
- Stephenson, C., & Sanduleak, N. 1971, Publ. Warner and Swasey Obs., 1, 1 [NASA ADS] [Google Scholar]
- Sung, H., Bessell, M. S., Park, B. G., & Kang, Y. H. 1999, JKAS, 32, 109 [NASA ADS] [Google Scholar]
- van der Hucht, K. A. 2001, New Astron. Rev., 45, 135 [NASA ADS] [CrossRef] [Google Scholar]
- Vasilevskis, S., Sanders, W. L., & van Altena, W. F. 1965, AJ, 70, 806 [NASA ADS] [CrossRef] [Google Scholar]
- Walborn, N. R. 1972, AJ, 77, 312 [NASA ADS] [CrossRef] [Google Scholar]
- Wood, D. O. S., & Churchwell, E. 1989, ApJS, 69, 831 [NASA ADS] [CrossRef] [Google Scholar]
- Zacharias, N., Finch, C., & Frouard, J. 2017, AJ, 153, 166 [NASA ADS] [CrossRef] [Google Scholar]
Appendix A
Individual stellar radial velocities
For the determination of the radial velocities (Sect. 3.4) we analyzed digital spectra obtained by us for some stars present in the Bochum 7 region. Details of the instrumental configuration employed to obtain the spectra are given in Sect. 2.2 of Paper I. Table A.1 of this paper lists some characteristics of the CASLEO4 runs.
Instrumental configurations used.
The radial velocity of each star was obtained measuring the absorption lines of Hγ, HeI 4471 Å, Hβ and HeI 4922 Å found in its spectra. Probable members of Bo 7 are shown in Table 2. Here, we present the heliocentric radial velocity with the standard deviation of the radial velocity average and the instrumental configuration in two pairs of parentheses. There are several stars for which it was not possible to obtain a good estimate of radial velocity from spectra. The ALS Catalog stars 1135 (CBN 84349.6-460711), 1131 (CBN 84324.0-460831), 1144 (CBN 84424.9-455334), 1146 (CBN 84450.9-461012) and 1147 (CBN 84506.3-460906) show variations in radial velocity in their spectra.
CBN84324.0-460831 (ALS 1131): heliocentric radial velocities.
ALS 1135 is a binary system presented by Corti et al. (2003), Fernández Lajús & Niemela (2006) and Michalska et al. (2013). The radial velocities measured in the other stars are presented from Tables A.2 to A.5. They list Heliocentric Julian Day, instrumental configuration, heliocentric radial velocity (with the number of measured lines to average in parentheses) and in the last column, standard deviation of radial velocity average. The presence of systematic differences between the lines of spectra obtained from night to night could be due to a binary effect. ALS 1131 is the star showing the greatest radial velocity dispersion with −45 km s−1 ≤ Vr ≤ 160 km s−1. This star presents an additional characteristic typical of binary systems: the variation of the intensity ratio of HeI 4471/HeII 4541, known as the Struve-Sahade effect (Bagnuolo et al. 1999). The intensity ratios obtained between the lines of HeI 4471 and HeII 4541 vary between 1.6 and 2.4. These data suggest this star to be a highly probable binary system, although more data with better resolution are needed. ALS 1144 is another star showing a large radial velocity dispersion with −26 km s−1 ≤ Vr ≤ 100 km s−1. ALS 1146 shows radial velocity dispersion values somewhat smaller than the other binary star candidates (80 km s−1), so it could be a longer-period binary system. ALS 1147 is a star with hydrogen Balmer lines in emission in its spectra and we found a large dispersion in its radial velocity values, flagging it as another probable binary system.
CBN84424.9-455334 (ALS 1144): heliocentric radial velocities.
CBN84450.9-461012 (ALS 1146): heliocentric radial velocities.
CBN84506.3-460906 (ALS 1147): heliocentric radial velocities.
The stars ALS 1137 (CBN 84350.9-460348), ALS 1140 (CBN 84404.4-455316), CBN 84325.6-460820 and CBN 84438.9-460746 also show variations in their radial velocity, and they are listed in Table A.6. For these four stars, more spectral data are required to confirm that the stellar radial velocity is indeed variable.
Heliocentric radial velocities.
All Tables
Spectrophotometric information of stars in Bo 7, including distance modulus determination and measured radial velocities.
All Figures
|
Fig. 1. Spatial distribution of the stellar association. Panel a: open circles around the dots represent the 123 stars with similar proper motions identified in the first analysis; the points represent the rest of the stars of the region; a total of 219 stars. Panel b: open circles represent the 27 astrometric and spectrophotometric Bo 7 association members. All of them were derived using the model proposed by Orellana et al. (2010). |
| In the text | |
|
Fig. 2. VPD of the stellar association consulting the UCAC5 catalog. Panel a: maximum likelihood method assigns the Gaussian distribution bivariate elliptic to the 186 field stars. Points outside ellipse represent the rest of the region’s stars in the first analysis. Panel b: a zoom image of the square indicated in panel a. Open circles around the dots represent the 123 astrometric members that the maximum likelihood method assigns the Gaussian circular distribution bivariate. Panel c: open circles represent the 27 astrometric and spectrophotometric association Bo 7 members. All of them were obtained using the model proposed by Orellana et al. (2010). |
| In the text | |
|
Fig. 3. LSR corrected radial velocity vs. distance of Bo 7 member candidates plotted as blue crosses with their corresponding error bars. The pink curve displays the fit of the galactic rotation model applied to the third quadrant of our Galaxy (Brand & Blitz 1993). Star #4288 is the only member more than 3σ away from its expected location (discussed further below). As a reference, star #3705 is the ALS 1135 binary system. |
| In the text | |
|
Fig. 4. CMD of member stars of Bo 7. The MS stars among O6.5 and B0 are identified with light blue triangles, the MS stars among B1 and B6 are identified with yellow triangles, and the luminosity class-III stars among B0 and B2 are identified with yellow open triangles. The thicker continuous curve is the Schmidt-Kaler (1982) HR diagram for early stars; the other curves are Marigo & Girardi (2008) isochrones for z = 0.02. All the reference curves are corrected by an apparent distance modulus of 13.7. |
| In the text | |
|
Fig. 5. Spatial distribution of the Bo 7 members. The WR12 star is identified with a large lilac dot and the IRAS source is identified with a green asterisk. The other symbols are the same as those in Fig. 4. |
| In the text | |
|
Fig. 6. Photometric diagrams for star members of Bo 7. Dashed lines indicate the normal reddening path (Rieke & Lebofsky 1985). The black and lilac solid curves are the unreddened and shifted curves, respectively. The lilac solid curve has been shifted according to the color excess MS (Koornneef 1983). |
| In the text | |
Current usage metrics show cumulative count of Article Views (full-text article views including HTML views, PDF and ePub downloads, according to the available data) and Abstracts Views on Vision4Press platform.
Data correspond to usage on the plateform after 2015. The current usage metrics is available 48-96 hours after online publication and is updated daily on week days.
Initial download of the metrics may take a while.