Free Access
Fig. 6.
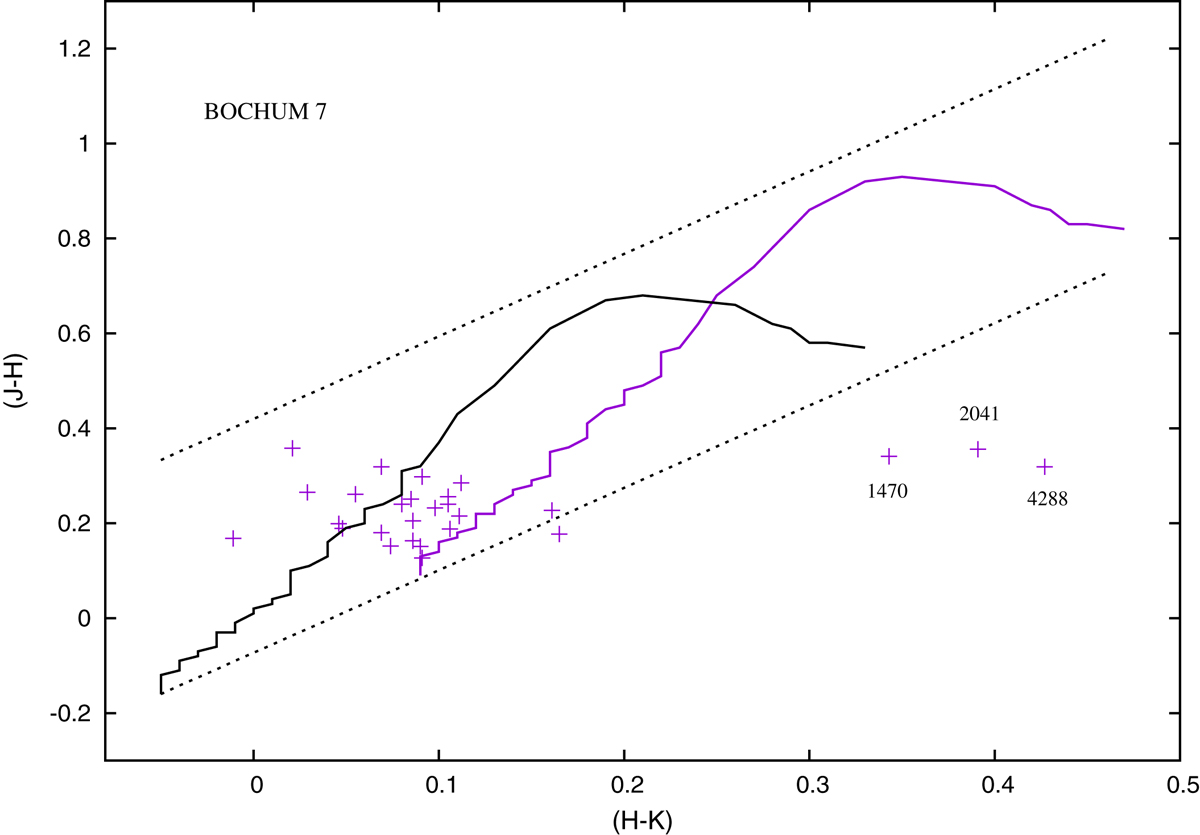
Photometric diagrams for star members of Bo 7. Dashed lines indicate the normal reddening path (Rieke & Lebofsky 1985). The black and lilac solid curves are the unreddened and shifted curves, respectively. The lilac solid curve has been shifted according to the color excess MS (Koornneef 1983).
Current usage metrics show cumulative count of Article Views (full-text article views including HTML views, PDF and ePub downloads, according to the available data) and Abstracts Views on Vision4Press platform.
Data correspond to usage on the plateform after 2015. The current usage metrics is available 48-96 hours after online publication and is updated daily on week days.
Initial download of the metrics may take a while.