Fig. 7
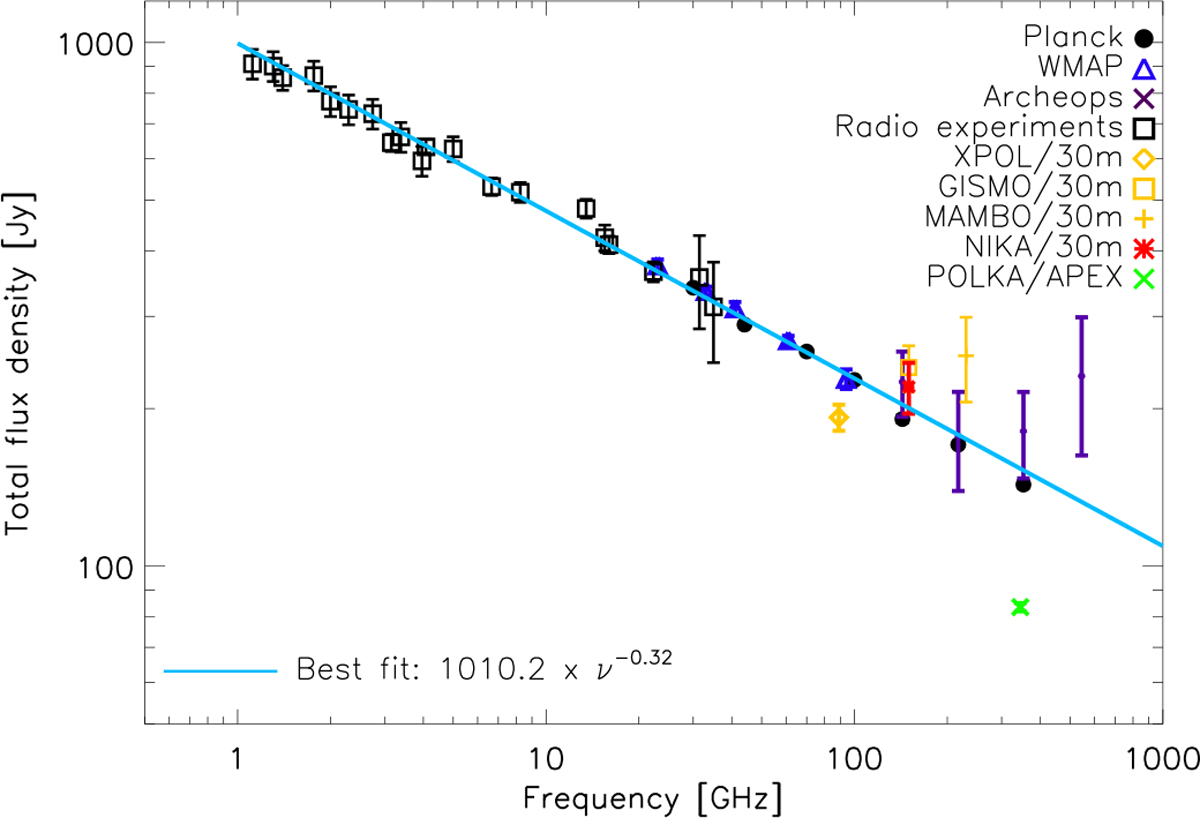
Crab nebula total power SED as obtained from Planck (Planck Collaboration XXVI 2016) for the LFI instrument, Planck HFI data reanalysed from the maps that will be soon published in (Planck Collaboration III 2018), WMAP (Weiland et al. 2011), Archeops (Macías-Pérez et al. 2007), radio experiments (Dmitrenko et al. 1970; Vinogradova et al. 1971), XPOL/30 m (Aumont et al. 2010), NIKA/30 m (this paper), MAMBO/30 m (Bandiera et al. 2002), POLKA/APEX (Wiesemeyer et al. 2014), and GISMO/30 m (Arendt et al. 2011) data. NIKA and POLKA values are estimated over the entire extent of the source. The best-fit single power law model obtained by the analysis in this paper is shown in cyan. The best-fit models and the data both account for the Crab nebula fading with time, using 2018 as year of reference. The POLKA data flux loss (~40%) is compatible with the losses expected due to the spatial filtering of total intensity in the LABOCA data reduction (Belloche et al. 2011).
Current usage metrics show cumulative count of Article Views (full-text article views including HTML views, PDF and ePub downloads, according to the available data) and Abstracts Views on Vision4Press platform.
Data correspond to usage on the plateform after 2015. The current usage metrics is available 48-96 hours after online publication and is updated daily on week days.
Initial download of the metrics may take a while.