Fig. 5
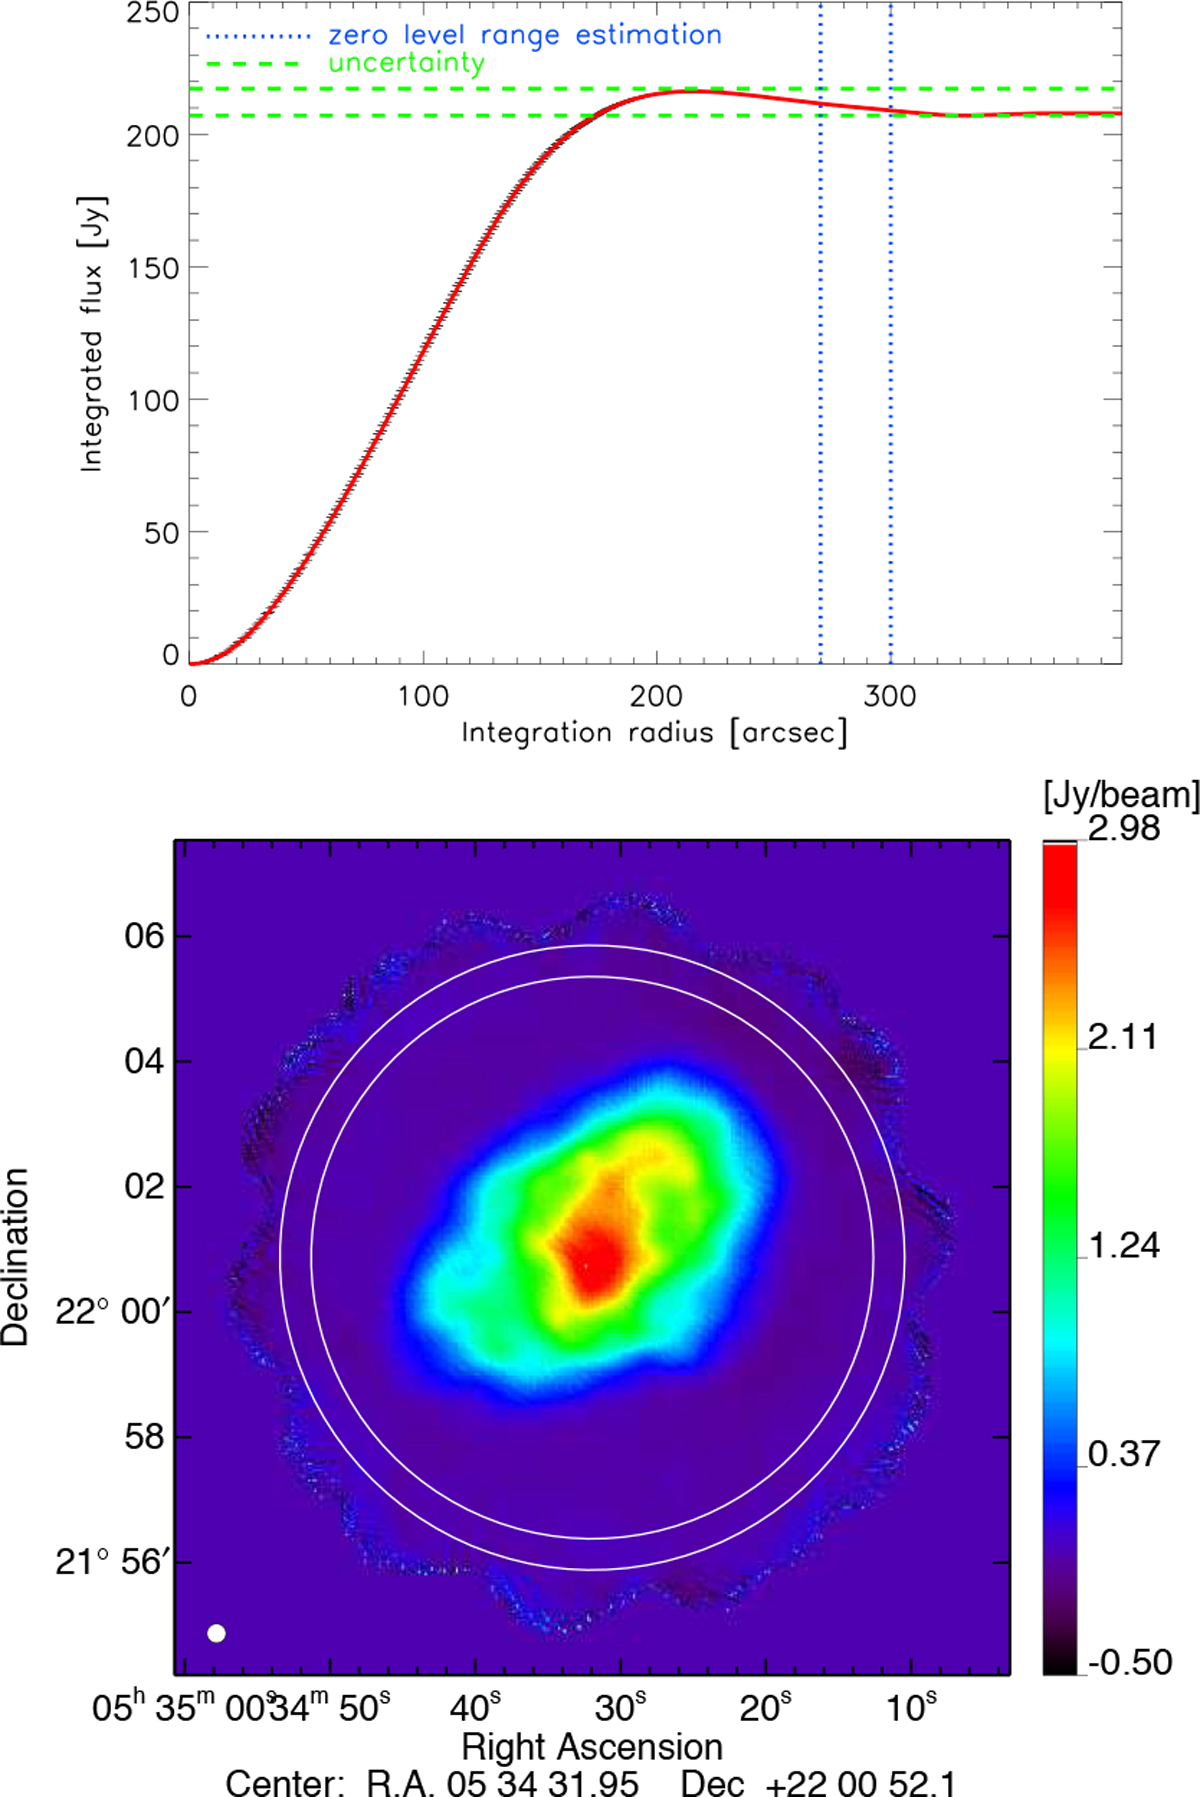
Cumulative flux of the Crab nebula (top panel) obtained at 150 GHz over 5′ from the centre obtained by aperture photometry. The flux has been corrected by a zero level in the map, which corresponds to the mean of the signal calculated in an annular ring, as indicated by the white circles on the map and by the blue dotted lines on the top. The green dotted line represents the uncertainties measured at large radii.
Current usage metrics show cumulative count of Article Views (full-text article views including HTML views, PDF and ePub downloads, according to the available data) and Abstracts Views on Vision4Press platform.
Data correspond to usage on the plateform after 2015. The current usage metrics is available 48-96 hours after online publication and is updated daily on week days.
Initial download of the metrics may take a while.