Fig. 3
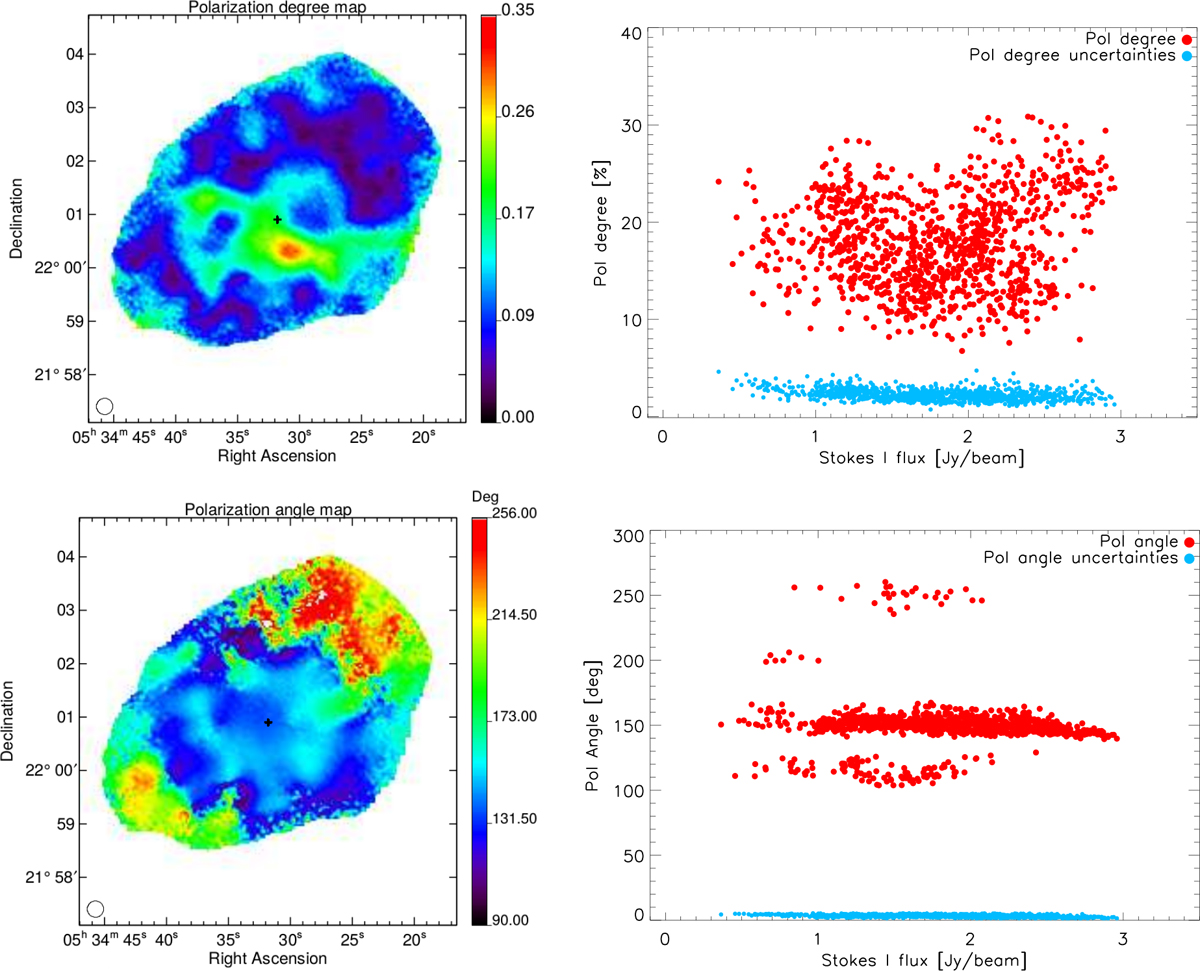
Top left panel: polarization degree map p, uncorrected for noise bias, of the Crab nebula. Top right panel: noise bias corrected p values as a function of total intensity map (Stokes I). The condition Ipol > 5![]() is satisfied for those values. Bottom left panel: polarization angle map ψ (equatorial coordinates system) of the Crab nebula. Bottom right panel: distribution of ψ values represented as a function of the total intensity in the case of very high S/N where Ipol > 5
is satisfied for those values. Bottom left panel: polarization angle map ψ (equatorial coordinates system) of the Crab nebula. Bottom right panel: distribution of ψ values represented as a function of the total intensity in the case of very high S/N where Ipol > 5![]() . The cyan dots represent the uncertainties calculated as the dispersion between different observational scans. The black cross marks the pulsar position on the maps.
. The cyan dots represent the uncertainties calculated as the dispersion between different observational scans. The black cross marks the pulsar position on the maps.
Current usage metrics show cumulative count of Article Views (full-text article views including HTML views, PDF and ePub downloads, according to the available data) and Abstracts Views on Vision4Press platform.
Data correspond to usage on the plateform after 2015. The current usage metrics is available 48-96 hours after online publication and is updated daily on week days.
Initial download of the metrics may take a while.