| Issue |
A&A
Volume 616, August 2018
|
|
|---|---|---|
| Article Number | A49 | |
| Number of page(s) | 9 | |
| Section | Stellar structure and evolution | |
| DOI | https://doi.org/10.1051/0004-6361/201730673 | |
| Published online | 14 August 2018 | |
Physical parameters and ±0.2% parallax of the detached eclipsing binary V923 Scorpii⋆
1
Astronomical Institute, Slovak Academy of Sciences, 059 60 Tatranská Lomnica, Slovakia
e-mail: This email address is being protected from spambots. You need JavaScript enabled to view it.
2
European Southern Observatory, Alonso de Córdova 3107, Casilla 19001, Santiago 19, Chile
3
Unidad Mixta Internacional Franco-Chilena de Astronomía (CNRS UMI 3386), Departamento de Astronomía, Universidad de Chile, Camino El Observatorio 1515, Las Condes, Santiago, Chile
4
LESIA (UMR 8109), Observatoire de Paris, PSL Research University, CNRS, UPMC, Univ. Paris-Diderot, 5 Place Jules Janssen, 92195 Meudon, France
5
Department of Mathematics, Physics and Geology, Cape Breton University, 1250 Grand Lake Road, B1P 6L2 Sydney, Nova Scotia, Canada
6
Canadian Coast Guard College, Department of Arts, Sciences, and Languages, Sydney, Nova Scotia B1R 2J6, Canada
7
Max-Planck-Institut für Astronomie, Königstuhl 17, 69117 Heidelberg, Germany
8
Max Planck Institute for Extraterrestrial Physics, Giessenbachstr., 85748 Garching, Germany
9
Faculdade de Engenharia, Universidade do Porto, rua Dr. Roberto Frias, 4200-465 Porto, Portugal
10
CENTRA – Centro de Astrofísica e Gravitação, IST, Universidade de Lisboa, 1049-001 Lisboa, Portugal
11
Physikalisches Institut, Universität zu Köln, Zülpicher Str. 77, 50937 Köln, Germany
12
Department of Physics and Astronomy, University of British Columbia, Vancouver, BC V6T1Z1, Canada
13
Département de physique, Université de Montréal, CP 6128, Succursale Centre-Ville, Montréal, QC H3C 3J7, Canada
14
Department of Astronomy and Astrophysics, University of Toronto, 50 St George Street, Toronto, ON M5S 3H4, Canada
15
University of Vienna, Institute for Astronomy, Türkenschanzstrasse 17, 1180 Vienna, Austria
Received:
22
February
2017
Accepted:
18
April
2018
Abstract
Context. V923 Sco is a bright (V = 5.91), nearby (π = 15.46 ± 0.40 mas) southern eclipsing binary. Because both components are slow rotators, the minimum masses of the components are known with 0.2% precision from spectroscopy. The system seems ideal for very precise mass, radius, and luminosity determinations and, owing to its proximity and long orbital period (~34.8 days), promises to be resolved with long-baseline interferometry.
Aims. The principal aim is very accurate determinations of absolute stellar parameters for both components of the eclipsing binary and a model-independent determination of the distance.
Methods. New high-precision photometry of both eclipses of V923 Sco with the MOST satellite was obtained. The system was spatially resolved with the VLTI AMBER, PIONIER, and GRAVITY instruments at nine epochs. Combining the projected size of the spectroscopic orbit (in km) and visual orbit (in mas) the distance to the system is derived. Simultaneous analysis of photometric, spectroscopic, and interferometric data was performed to obtain a robust determination of the absolute parameters.
Results. Very precise absolute parameters of the components were derived in spite of the parameter correlations. The primary component is found to be overluminous for its mass. Combining spectroscopic and interferometric observations enabled us to determine the distance to V923 Sco with better than 0.2% precision, which provides a stringent test of Gaia parallaxes.
Conclusions. It is shown that combining spectroscopic and interferometric observations of nearby eclipsing binaries can lead to extremely accurate parallaxes and stellar parameters.
Key words: binaries: spectroscopic / binaries: eclipsing / stars: fundamental parameters / parallaxes / stars: distances
Based on observations made with ESO telescopes at the Paranal Observatory, under ESO program 091.D-0207 and data from the MOST satellite, a former Canadian Space Agency mission, jointly operated by Microsatellite Systems Canada Inc. (MSCI; formerly Dynacon Inc.), the University of Toronto Institute for Aerospace Studies, and the University of British Columbia; assistance was provided by the University of Vienna.
ESO visiting scientist.
© ESO 2018
1. Introduction
HR6327 (V = 5.91) was found to be a SB2 system by Bennet et al. (1963). The authors determined an orbital period of P = 34.8189 days and estimated the spectral types of its components as F3IV-V and F3V. Using HR6327 as a comparison star, Bolton & Herbst (1976) serendipitously discovered a primary eclipse in the system of depth 0.35 mag. Kholopov et al. (1981) included the system in the GCVS as V923 Sco.
Fekel et al. (2011, hereafter F11) presented new high-dispersion CCD spectroscopic observations. Fifty-six radial-velocity measurements for both components led to the masses of the components; these measurements have about 0.2% precision and result in an orbital eccentricity of e = 0.472. The continuum flux ratio of the secondary to primary component was found to be 0.754 (Δ mag = 0.31) at 6430 Å. The spectra showed that the components are slow rotators; the υ1 sin i = 5.2 ± 1.0 km s−1 and υ2 sin i = 8.0 ± 1.0 km s−1. A pseudosynchronous rotational velocity was estimated as 7 km s−1 for both components. The authors also indicated the system to be suitable for long-baseline interferometric observations.
The search for a possible secondary eclipse in the photometry of Bolton & Herbst (1976) at the predicted spectroscopic conjunction (at phase 0.3713 from the primary eclipse) was not conclusive owing to insufficient precision and quantity of the data. The HIPPARCOS photometry (HIP 83491) does not cover eclipses in the system and does not show any out-of-eclipse variability (95th and 5th brightness percentiles differ by only 0.02 mag). Unfortunately, the star is brighter than the magnitude range of ASAS1, V = 8–14. Searches in other all-sky databases yielded no useful photometry.
With very precise minimum component masses, the projected size of the orbit from spectroscopy, and the possibility of resolving the visual orbit with long-baseline interferometry the system promise not only precise absolute parameters of the components but also a model-independent determination of the distance.
The present paper is organized as follows: Sect. 2 describes high-precision satellite photometry and VLTI interferometry of the system, Sect. 3 gives a preliminary analysis of individual datasets, and Sect. 4 describes the simultaneous analysis of all datasets. The absolute parameters of the components and their evolutionary stage are discussed in Sects. 5 and 6, respectively.
2. 2. New observations and data reduction
Having very precise minimum masses for the components from F11, M1 sin3i = 1.4708(31) M⊙ and M2 sin3i = 1.4178(23) M⊙, but only limited photometry (Bolton & Herbst 1976) the system was subject to new photometric and interferometric observations.
2.1. MOST photometry
The Microvariability and Oscillations of STars (MOST) microsatellite houses a 15-cm telescope, which feeds a CCD photometer through a single, broadband optical filter (350–700 nm). The initial post-launch performance was described by Matthews et al. (2004). Although the original mission goals were asteroseismology of bright (V < 6) solar-type stars, Wolf–Rayet and magnetic pulsating stars, MOST obtained photometry of all kinds of variable stars, transiting exoplanets but also of a few dozens of eclipsing binary stars (see Pribulla et al. 2010).
Unfortunately, V923 Sco is outside the so-called continuous viewing zone; thus, it was alternated with other objects to charge MOST batteries using built-in solar panels (see Walker et al. 2003). Hence, the photometry is noncontinuous and the data segments repeat with the orbital period of the satellite (101.4 min). The new observations were focused on the eclipses in the system using the spectroscopic prediction of F11.
The MOST frames were reduced in the following steps: (1) clipping two-sigma outliers in counts and telescope pointing position, which was repeated twice; (2) removing the power at all frequencies less than 3 c/d that have S/N > 10; (3) filtering of sky background and inter-pixel variations using polynomials; (4) filtering of orbital modulation of scattered light by removing patterns averaged across 35 bins phased at the MOST satellite orbital period; (5) clipping three-sigma outliers in data averaged in 50-point bins; and (6) restoring power removed in step 2.
In 2012, the photometry was obtained from May 12 to May 18 (the secondary eclipse) and from May 31 to June 12 (the primary). Unfortunately, the 2012 data suffer from a saturation of the CCD at maximum light. Only part of the primary minimum is below the saturation level and could be used. The observations were therefore repeated in 2014 on May 1 and 2 (the primary eclipse) and July 23 and 24 (the secondary). The out-of-eclipse light curve shows about 1.8 mmag scatter (as determined from the best fit). The photometry covers both minima. Because of the eccentric orbit the primary minimum is about 0.38 mag deep and partial, while the secondary is a grazing eclipse with only Δmag = 0.013. The presence of the secondary eclipse is, however, crucial for reliable element determination.
2.2. Long-baseline interferometry
Using the projected size of the orbit from F11, a sin i = 0.2971(2) au, and the HIPPARCOS parallax π = 15.46(40) mas (van Leeuwen 2007)2, the expected apparent size of the orbit is a sin i = 4.59 mas. The angular sizes of the components assuming R1 = 2.0 R⊙ and R2 = 1.9 R⊙ (F11) are expected to be only 0.29 and 0.27 mas.
We observed V923 Sco over 16 epochs spread between April 2013 and June 2014, using the Very Large Telescope Interferometer (Berger et al. 2010; Mérand et al. 2014) equipped with the three-telescope beam combiner AMBER (Petrov et al. 2007), or the four-telescope beam combiner PIONIER (Le Bouquin et al. 2011). The 1.8 m auxiliary telescopes were positioned on the A1-G1-J3 and D0-H0-G1 baseline triplets for the AMBER observations, and the A1-G1-K0-J3 quadruplet for the single PIONIER observing epoch. These configurations provide ground baselines between 56 and 140 m, which are suitable for the resolution of the angular separation of the two components of V923 Sco. We also observed V923 Sco using the GRAVITY instrument (Gravity Collaboration et al. 2017) of the VLTI in June and July 2017. The operational wavelength band of GRAVITY is the K band. The science combiner includes a dispersive element that provides wavelength-dependent measurements of the interferometric quantities (e.g., fringe visibilities and phases) at spectral resolutions of R = 20, 500, and 4500. For our observations of V923 Sco, GRAVITY was used in medium spectral resolution (R = 500) and in single field mode, that is, its two beam combiners were recording fringes on V923 Sco.
The system was well resolved during nine epochs. The disks of the components were unresolved. Each observation consisted of three pointings: calibrator, V923 Sco, and calibrator. Two stars were used as calibrators: HD 153368 (θH = 1.005 ± 0.014 mas, θK = 1.009 ± 0.014 mas3; Mérand et al. 2005, the AMBER and the GRAVITY observations), and HD 159941 (θH = 1.081 ± 0.015 mas, θK = 1.089 ± 0.015 mas; Mérand et al. 2005, the AMBER and the PIONIER observations). Each pointing took 20 min, leading to a total of 1 hour per observation. The list of observations with the corresponding configurations is presented in Table 1.
The AMBER raw data have been reduced using amdlib v34. The PIONIER raw data were reduced using pndrs5. The GRAVITY data were reduced using the standard GRAVITY Data Reduction System version 1.0 (Lapeyrere et al. 2014). The binary separations were computed from the reduced files for each epoch using CANDID (Gallenne et al. 2015). Because the closure phase was always achieved (three baselines for the AMBER and six for the PIONIER instrument) giving the measure and direction of the object asymmetry, the secondary position is known without the ±180 degrees ambiguity affecting the case of two baselines or speckle interferometry.
As an illustration, Fig. 1 shows the result of the CANDID adjustment of a binary star model (red curves) to the interferometric observables produced by the GRAVITY instrument for the observation recorded on 2 July 2017.
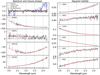 |
Fig. 1. Closure phases (left column) and squared visibilities (right column) of V923 Sco measured with GRAVITY on 2 July 2017 (HJD=2457936.587). The best fit CANDID binary star model is represented with red curves in each panel. The recorded photometric spectrum is also shown in the upper left panel before and after the correction of the telluric absorption lines. |
The errors of the relative positions derived from interferometric observations strongly depend on the direction on the sky. This results from insufficient and nonuniform coverage of the aperture and causes the synthesized PSF to be elongated at a certain angle. Hence errors of all positional measurements were represented by ellipses. Their major axis and orientation were determined by bootstrapping of the data. For all epochs 1000 bootstrapping experiments were performed.
An additional source of position uncertainty of the interferometric observations is the precision of the wavelength calibration. The extra errors were estimated at 5%, 2.5%, and 0.1% for the AMBER, PIONIER, and GRAVITY beam combiners, respectively. The wavelength uncertainty was taken into account in the error ellipses.
The relative positions of the secondary component and the flux ratio (F2/F1) are listed in Table 1. The average flux ratio in the H + K photometric band, F2/F1 = 0.82 ± 0.02, is larger than the spectroscopic flux ratio. This means that the secondary component is redder (=cooler) than the primary.
Relative astrometric position, ΔX and ΔY, of the secondary component of V923 Sco determined from the VLTI observations.
2.3. Observed colors and surface temperatures
According to the 2MASS catalog (Skrutskie et al. 2006), J = 5.160(29), H = 4.981(24), and Ks = 4.895(20) for V923 Sco. The observation was performed just after the primary eclipse at phase 0.00970(5) (ephemeris from Table 2). Using the transformation of Bessell & Brett (1988) Ks transforms to K = 4.934(20).
Feinstein & Forte (1974), studying the field of NGC 6281, listed the visual magnitudes and colors of V923 Sco as V = 5.90, B − V = 0.40, and U − B = −0.02 (three photoelectric observations)6 and mentioned that it is a nonmember object. The authors determined the distance to the cluster at d = 560 ± 30 pc, and interstellar reddening of E(B−V) = 0.15 ± 0.02. Assuming a uniform distribution of the interstellar material toward NGC 6281, and the HIPPARCOS distance ( ), leads to E(B−V) = 0.0173(25) for V923 Sco. The error is dominated by the reddening uncertainty toward NGC 6281.
If we adopt RK = AK/EB−V = 0.346 and RV = AV/EB−V = 3.09 (see Rieke & Lebofsky 1985), and assume uncertainty of the observed V magnitude as 0.01 mag, then the dereddened apparent brightness of the system is V = 5.846(12) and K = 4.928(20) and the corresponding color index (V − K)0 = 0.918(23).
The authors of F11 found that the components essentially have solar iron abundances. Their determination of masses and radii of the components corresponds to log g1 = 4.00 (cgs) and log g2 = 4.03 (cgs). Using the calibration of Worthey & Lee (2011) for solar iron abundance and log g = 4.00 and (V − K)0 = 0.918(23) we get Teff = 6820 ± 40 K. Using dereddened (B − V)0 = 0.383 leads to 6750 K. The (B − V)0 error can be estimated at about 0.02, which propagates to about an 80 K error of Teff. The effective temperature corresponds to the combined color of the components.
Photometric elements derived from the MOST observations of V923 Sco.
3. Separate analysis of datasets
The published radial velocities, the MOST light curve and the interferometric visual orbit were first analyzed separately to obtain preliminary parameters and reasonable error estimates for the data independent of formal errors of individual observations.
3.1. Published spectroscopy
In multi-dataset modeling of the system, the old photographic spectroscopy of Bennet et al. (1963) was not included because of the very large scatter. Hence, only new CCD spectroscopy of F11 was taken into account.
The authors do not list the errors of individual radial-velocity measurements, but comparing variances of the separate solutions for the primary and secondary component, adopt relative weights w1 = 1.0 and w2 = 0.3, respectively. In our analysis these weights were transformed (w = 1/σ2) to data uncertainties σ1 = 1.00 km s−1 and σ2 = 1.82 km s−1. The differential-correction optimization (i.e., the steepest-descent method in Press et al. 1986) of the radial velocities leads to practically the same spectroscopic elements as obtained by F11. The resulting χ2 = 2.4 for (112–7) degrees of freedom (d.o.f.) indicates that the true data uncertainties are 6.62 times smaller, that is, σ1 = 0.151 km s−1 and σ2 = 0.275 km s−1. The parameter errors, checked by the bootstrap and Monte Carlo techniques, are almost identical to those listed by F11. The minimum masses, M1 sin3i = 1.4708(31) M⊙ and M2 sin3i = 1.4178(23) M⊙ listed in their Table 5, obtained from the same spectroscopic elements, however, correspond to the solar-mass parameter, GM⊙, smaller by about 0.23% than adopted by the International Astronomical Union (IAU). Using the IAU resolution B3 for solar and planetary properties (Prša et al. 2016) with GM⊙ = 1.3271244(10) 1020 m3 s−2, we get the minimum masses as 1.4674(31) M⊙ and 1.4146(23) M⊙. The radial velocities define the orbital period as P = 34.838648(95) days.
3.2. MOST light curve
Adopting radius estimates and the projected size of the major axis from F11 and assuming that we see the orbit edge on, the ratios of component radii and the instantaneous separation are about R1/a(1 − e) = 0.059 and R2/a(1 − e) = 0.056 at periastron, and only R1/a(1 + e) = 0.021 and R2/a(1 + e) = 0.020 at apastron. This means very small proximity effects (tidal deformation, mutual irradiation, and gravity darkening).
Because of the slow rotation, the ellipsoidal deformation of the components is also small. If Requ and Rpol are the equatorial and polar radii and Ω/Ωcrit is the ratio of the observed and critical angular velocity, the flattening of a rotating star can be approximated by (see Rozelot & Neiner 2009) (1)
(1)
with (2)
(2)
where G is the gravitational constant and M is the mass of the star. For the secondary component of V923 Sco, which rotates faster of the two, υ2 sin i = 8 km s−1, the flattening is only 2.27 10−4.
The reflection effect also has very low amplitude. The fraction of the reflected light can be simply estimated (see Sen 1948) as  , where rj is the fractional radius of the reflecting component (the ratio of its radius and semimajor axis). If both components have the same luminosity, then the amplitude of the reflection effect is
  . In the case of V923 Sco this gives an amplitude <0.4 mmag, which is below the MOST photometry precision.
Thus for the preliminary parameter estimate it is sufficient to model the system by two spherical, limb-darkened stars revolving in an eccentric orbit. A simple program integrating light from the visible surface on the eclipsed component was used.
Unfortunately, fitting a model light curve to the observations of a detached eclipsing binary showing partial eclipses suffers from strong correlations between the parameters (see Southworth et al. 2007). The phase shift of the secondary minimum defines e cos ω very well, while e sin ω is less well defined by the ratio of minima duration (see Binnendijk 1960, pages 328–329). One can easily determine the sum of fractional radii of the components, r1 + r2, but not their ratio (and hence individual values, which are strongly correlated). The correlation stems from the fact that a depth of a partial eclipse depends primarily on the impact factor (product of separation of components and cos i) and the sum of the radii. The inclination angle, on the other hand, is well determined.
To arrive at a meaningful solution, the spectroscopic flux ratio F2/F1 = 0.754 (at 6430 Å) was used as an additional dataset to constrain the solutions. Its uncertainty was set (rather arbitrarily) to 0.001. The flux ratio of the components was determined using the following formula for the linear limb-darkening approximation (see Gray 2008): (3)
(3)
where r1, r2 are the fractional radii of the components, I1, I2 are central intensities of the disks, and u1, u2 are the linear limb-darkening coefficients for the components. The coefficients were interpolated from dedicated tables of Claret et al. (2014) for the MOST satellite photometry as u1 = u2 = 0.6194 for Vξ = 2 km s−1, Teff = 6700 K, log g = 4.0, and [M/H] = 0.
In addition to the 2014 MOST data, only the nonsaturated part of the 2012 MOST light curve during the primary minimum has been used. Using the data from both years better defines the orbital period but also the shape of the primary minimum.
The free parameters were the time of the primary minimum Tmin, the inclination angle i, the sum of fractional radii r1 + r2, the ratio of fractional radii r2/r1 < 1, e cos ω, e sin ω, and the central intensities of the disks, I1, I2. Because no additional component was detected in the spectroscopy, zero third light, l3, was assumed. All data points were given the same weight.
The resulting parameters are listed in Table 2 and corresponding fits in Fig. 2. The separate fractional radii are r1 = 0.03260(9) and r2 = 0.02922(8). The eccentricity is e = 0.4845(15) and the longitude of the periastron passage ω = 112.17(9) degrees. The computed flux ratio of the components, F2/F1 = 0.75404, is close to the input value.
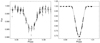 |
Fig. 2. Best fits to the secondary (left) and primary (right) minimum of V923 Sco. The 2014 data are plotted with filled circles, the nonsaturated 2012 data with open triangles. For clarity the data errors are not shown during the primary minimum (smaller than the symbols). The phases correspond to the optimum ephemeris for the primary minimum in Table 2. The best fit assuming two limb-darkened spheres is plotted with a solid line. The dotted line corresponds to a simultaneous modeling of the light-curve, radial-velocity and visual-orbit data (Sect. 4). |
Orbital elements of the visual orbit obtained from the VLTI, P - orbital period, e - eccentricity, i - inclination angle, T0 - time of periastron passage, ω - longitude of periastron, Ω - longitude of the ascending node, and a - semimajor axis.
3.3. VLTI visual orbit
The interferometric orbit of V923 Sco is the relative orbit of the fainter component around the brighter component of the eclipsing pair. Although the orientation toward the secondary component is determined without the 180-degree ambiguity, the longitude of the ascending angle Ω cannot be determined without spectroscopic observations. Because we only had the visual orbit, we would have two equally good solutions differing in ω and Ω by 180 degrees.
The longitude of periastron in the case of the spectroscopic orbit (112.853 ± 0.074 deg according to F11) is related to the primary component. Thus, we selected the solution with ω ~ 293 degrees because the relative visual orbit is the orbit of the secondary around the primary.
Nine ΔX (toward east) and ΔY (toward north) positions when the system was resolved with the VLTI were used. The uncertainty ellipses giving the positional uncertainty in the direction of the separation vector were used.
The parameters were adjusted using the differential-correction method. Because we only had nine separation vectors, we performed two solutions fixing some parameters from spectroscopy covering 6.5 yr. In the first solution only the orbital period was fixed and not adjusted. In the second solution the orbital period, eccentricity, time of the periastron passage, and longitude of the periastron were adopted.
The corresponding fit to the relative visual orbit is shown in Fig. 3. The value of reduced  indicates either slightly underestimated position errors or a deviating point(s). Combining the projected semimajor axis from spectroscopy, a sin i = 0.29705(19) au with apparent semimajor axis from interferometry (first solution), a sin i = 4.747(18) mas, we get the parallax of V923 Sco as 15.96(6) mas.
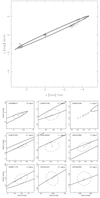 |
Fig. 3. Relative orbit of the secondary component of V923 Sco and its best fit assuming spectroscopic elements (P,e, ω, T0) (top). The nodal line is plotted by dash dots. Character “A” shows the position of the ascending node. Close-up view of error ellipses (dot-dashed line) at 9 epochs are shown at bottom. The orbit is prograde (counterclockwise motion on the sky). North is up and east is left on both panels. |
4. Simultaneous modeling of the datasets
The individual datasets, which were not obtained simultaneously, were light curve (HJD 2 456 083 and 2 456 863), radial velocities (2 453 092 – 2 455 465), and visual orbit (2 456 389 – 2 457 937). For a well-detached binary with ~34.8-day period we can, however, assume that the apsidal motion is too slow to cause significant changes of orbital elements throughout the whole time range of the observations (about 13.3 yr). In the case of the MOST observations, we used both 2012 (nonsaturated data in the primary minimum) and 2014 observations to define the orbital period better and to set constraints on the position of the secondary minimum.
Because the system is wide and proximity effects negligible (see Sect. 3.2), all observations were modeled assuming that components are two limb-darkened spheres. As discussed in Sect. 3.2, to constrain the ratio of radii, the flux ratio, F2/F1 = 0.754, from spectroscopy and, F2/F1 = 0.82 ± 0.02, from interferometry were included as additional datasets. Since we did not know the uncertainty of the spectroscopic light ratio, we set this value rather arbitrarily to 0.001. The linear limb-darkening coefficient for the MOST passband was adopted from Tables 5 and 13 of Claret et al. (2014) after each iteration7. The minima last only about 0.013 (secondary) and 0.011 (primary) of an orbital period. Hence, while we used outside the minima a 1/360 step in phase, we used a phase step that was seven times finer during the minima to synthesize the light curve and photo-centric radial velocity.
The multi-dataset analysis requires proper definition of the merit function to be minimized. The most obvious is to use reduced  , which for the case of combining light-curve and radial-velocity data is written as
![Mathematical equation: $$ \chi_r^2=\frac1{N_{LC}+N_{RV}}{\left[\overset{N_{LC}}{\underset{i=1}{\mathrm\Sigma}}\frac{{[ y_i{(m)-y_i{(o)}}]}^2}{\sigma_i^2}+\overset{N_{RV}}{\underset{i=1}{\mathrm\Sigma}}\frac{{[ z_i{(m)-z_i{(o)}}]}^2}{\sigma_i^2}\right]}, $$](/articles/aa/full_html/2018/08/aa30673-17/aa30673-17-eq9.gif) (4)
(4)
where NLC, NRV are the numbers of data points for light-curve and radial-velocity data, y are intensities, z are radial velocities, while “m” denotes model and “o” observed. If the number of data points is markedly different between the datasets and there is a discrepancy in optimal parameters, the optimization gives higher weight to the dataset with the larger number of points. A solution to avoid this problem is to give all datasets the same weight; this can be carried out by modifying Eq. (4) to![Mathematical equation: $$ \chi_r^2=\frac1{N_{LC}}\overset{N_{LC}}{\underset{i=1}{\mathrm\Sigma}}\frac{{[ y_i{(m)-y_i{(o)}}]}^2}{\sigma_i^2}+\frac1{N_{RV}}\overset{N_{RV}}{\underset{i=1}{\mathrm\Sigma}}\frac{{[z_i{(m)-z_i{(o)}}]}^2}{\sigma_i^2}. $$](/articles/aa/full_html/2018/08/aa30673-17/aa30673-17-eq10.gif) (5)
(5)
The optimization was performed by the differential correction method. The modified sum of  (Eq. (5)) was used as the merit function. The resulting parameters for all cases are listed in Table 4. The fit to the MOST light curve corresponding to the combined radial-velocity and light-curve solution is plotted in Fig. 2.
Most parameters are consistent within one or two σ between the solutions. Small inconsistencies are visible, for example, in the time of periastron passage. The light and radial-velocity curves better define the orbit orientation (ω) and eccentricity than the visual orbit. The position of the secondary eclipse observed by MOST perfectly defines e cos ω, while radial-velocity curves define e sin ω. On the other hand, the parallax of V923 Sco and the longitude of the ascending angle cannot be determined without the positional data. The temperature of the secondary component was determined with a very low formal error. The error estimate is affected by an unknown error of the spectroscopic flux ratio, F2/F1. Hence, it must be used with caution.
Multi-dataset modeling of V923 Sco observables.
5. Absolute parameters and distance
The distance and temperature consistency of the component can be checked using the absolute parameters of the components and the bolometric correction. Because proximity effects can be neglected and the components are very close to a spherical shape (see Sect. 3.2) their luminosity can be satisfactorily derived from Stefan–Boltzmann’s law. The absolute parameters corresponding to the combined light-curve and radial-velocity solution are listed in Table 5. We used the IAU resolution B3 prescriptions for the solar and planetary properties (Prša et al. 2016)8.
Using bolometric corrections interpolated from Table 1 of Popper (1980), B.C. = −0.018 (for T1 = 6750 K) and B.C. = −0.026 (for T2 = 6562 K) and Mbol⊙ = 4.74, we get the absolute visual magnitudes as MV1 = 2.547 ± 0.026 and MV2 = 2.873 ± 0.027 and the combined absolute brightness MV = 1.945 ± 0.037. For the observed dereddened visual brightness V = 5.846(12) this gives the distance d = 60.28 ± 1.10 pc or π = 16.59 ± 0.30 mas. The combined solution of radial-velocity and visual-orbit data resulted in a model-independent parallax π = 15.975 ± 0.026 mas or distance d = 62.59 ± 0.09 pc. To reach a model-independent distance, the components would have to be slightly cooler and thus less luminous. The model-independent distance deviates more than one sigma from the revised HIPPARCOS parallax of 15.46 ± 0.40 mas or  pc but is reasonably consistent with the original HIPPARCOS data reduction (π = 15.61 ± 0.80 mas). The discrepancy can, partially, result from the photocenter motion in this high-eccentricity system not accounted for in the HIPPARCOS astrometry reductions. The photocenter semiamplitude can be found as
 (6)
(6)
where α is the maximum separation, q = M2/M1 the mass ratio, and F2/F1 is the flux ratio. If q = 0.964, α = 5.36 mas, and F2/F1 = 0.754 (assuming that the flux ratio in the HIPPARCOS band was the same as the spectroscopic ratio at 6430 Å), we have A = 0.33 mas. This is not a negligible oscillation compared to the HIPPARCOS data precision.
The distance to V923 Sco can also be checked using the surface brightness-color relations derived from long-baseline interferometry. Relations giving empirical stellar angular diameters for a zero-magnitude star can be found in Boyajian et al. (2014). Using the polynomial coefficients from their Table 1 for (V − K)0 = 0.918(23) (Sect. 2.3) we get the zero magnitude angular radius as θmV=0
= 5.96 ± 0.08 mas. Combining the relation for the angular radius of a star (in mas), (7)
(7)
where R is the radius of a star in solar radii and d is the distance in pc, and using the obvious equation V = −5 log(θ/θ0) we get for the magnitude of a star (8)
(8)
Assuming d = 62.59 pc (our combined radial-velocity and visual-orbit solution) we have V1 = 6.53(3) and V2 = 6.73(3) or V = 5.87(3). This is consistent with the dereddened brightness of V923 Sco, V = 5.846(12).
Absolute parameters of the components of V923 Sco from the combined light-curve and radial-velocity curve solution.
6. Evolutionary state
The evolutionary state of the components was studied by F11 using the Padova solar-abundance tracks (G2000, Girardi et al. 2000). Their Fig. 3 shows that the primary component of V923 Sco is overluminous for its mass. Its luminosity corresponds to about 5% larger theoretical mass. The secondary position was consistent with theory.
Because of the high inclination angle, i ~ 87.7 degrees, the true masses of the components are only 0.24% higher than the minimum masses of F11. Although the radii of the components of V923 Sco are now known with higher precision, the luminosity is more uncertain because of the use of color-temperature calibrations, which contain about 40 K error (Kervella et al. 2004). The radii of the components also depend on the flux ratio. Having both the continuum flux ratio from the spectroscopy of F11 and the H + K band flux ratio from new interferometry puts a strong constraint on the modeling.
While the luminosities and temperatures of the components are encumbered with the error related to color-temperature relations, their masses and radii are now known with 0.1–0.2% errors. This is enough to perform tests of stellar evolution models (see, e.g. Torres et al. 2010). V923 Sco was studied using (i) the G2000 and (ii) Yonsei-Yale (Y2, Demarque et al. 2004) evolutionary tracks and isochrones. In both cases, models corresponding to solar chemical abundance were used. Both libraries use similar physics but the Y2 models differ in a number of details such as the treatment of convective core overshooting, and helium- and heavy-element diffusion. The position of the components of V923 Sco in the Teff − log g plane for both model libraries is shown in Fig. 4. The figure shows the primary component of V923 Sco to be overluminous for its mass for both model libraries, while the parameters of the secondary component are consistent with the theory.
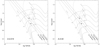 |
Fig. 4. Hertzsprung–Russell diagram for the components of V923 Sco. Left panel: isochrones and evolutionary tracks of Girardi et al. (2000); right panel: those of Demarque et al. (2004). The tracks assuming convective overshooting and solar metallicity were selected in both cases. The temperature uncertainties were set to 200 K. The absolute parameters of the components correspond to the combined solution of MOST light curve and published radial-velocity data. |
The masses and radii of the components of V923 Sco are plotted together with data of other detached eclipsing binaries listed in the online version9 of DEBCat (Southworth 2015) in Fig. 5. The figure shows rather good agreement of the observed masses and radii for both components of V923 Sco with the theoretical isochrone for 2 Ga with about 0.1 Ga uncertainty.
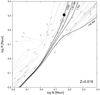 |
Fig. 5. Mass-radius diagram for V923 Sco (large symbols). The measurements are compared to theoretical isochrones of Girardi et al. (2000) for 100 Ma to 2 Ga for solar metallicity (Y = 0.70, Z = 0.02). The tracks assuming convective overshooting were selected. The vectors connect the positions of secondary to primary components in other well-studied detached binaries in DEBcat of Southworth (2015). |
7. Discussion and conclusions
Eclipsing binaries are crucial objects for astrophysics. Combining photometric and spectroscopic observations enables us to determine absolute parameters of stars that are necessary to test models of stellar evolution. Adding positional measurements and flux ratios (determined from spectroscopy and interferometry) gives an additional constraint and makes the results more robust.
We obtained high-precision photometry of both eclipses of V923 Sco with the MOST satellite and the spatially resolved orbit with the VLTI at nine epochs. Combining the projected size of the spectroscopic orbit, a sin i, and that from the visual orbit we derive the distance to the system. Simultaneous analysis of photometric, spectroscopic, and interferometric data leads to the first reliable determination of the absolute parameters.
The main results of the combined analysis of published spectroscopic data, new satellite photometry, and VLTI interferometry of V923 Sco are as follows:
-
First detection of the secondary eclipse of V923 Sco at phase φII = 0.370457(19), which defines the orientation of the orbit very well and sets a constraint on the photometric elements.
-
Model-independent determination of the distance to the system, d = 62.59 ± 0.09 pc, found by comparing a sin i from interferometric visual orbit and the projected major axis determined from spectroscopy. The error takes into account wavelength uncertainties of the interferometric combiners used.
-
Model-dependent determination of the distance based on the physical parameters and apparent brightness of the system, d = 60.28 ± 1.10 pc or π = 16.59 ± 0.30 mas. This indicates that the components are slightly cooler than those found by spectroscopy.
-
Determination of the fundamental parameters of the two components with superb accuracy (see Table 5).
-
The mass-radius diagram for the system indicates that the age of the system is close to 2 Ga.
The formal precision of the model-independent parallax, 26 μas, is several times worse than can be expected for single objects in the bright-star regime of the Gaia spacecraft (see de Bruijne 2012). Still, V923 Sco is an important benchmark system to test the Gaia parallaxes (see Stassun & Torres 2016).
With reliable component radii the system can also be used to calibrate surface brightness-color relations (see Graczyk et al. 2017).
Although the combined solution resulted in very accurate component parameters and orbital elements, the solution strongly depends on the spectroscopic flux ratio F2/F1 = 0.754 found by F11. The modeling, however, shows that the interferometric estimate in the near-infrared is consistent with the spectroscopic estimate. While the observed masses and radii show good accord with the 2 Ga isochrone, the primary component is overluminous for its mass.
Note added in proof. The parallax of V923 Sco published in the second Gaia data release issued on April 25, 2018 is π = 16.070 ± 0.054 mas (Gaia Collaboration et al. 2018). The remarkable agreement with our independent orbital parallax π = 16.018 ± 0.009 mas (Δπ = 0.9 sigma) is a strong indication of the reliability of Gaia DR2 parallaxes, even close to the brightness limit of the satellite (G(V923 Sco) = 5.792).
Acknowledgments
The authors thank the anonymous referee for valuable comments that improved the manuscript significantly. This research took advantage of the SIMBAD and VIZIER databases at the CDS, Strasbourg (France), and NASA’s Astrophysics Data System Bibliographic Services. TP acknowledges support of the Fizeau exchange program (funding from the European Union’s FP7 research and innovation program under Grant Agreement 312430, OPTICON) and ESO visiting scientist program. This work has been supported by project VEGA 2/0031/18 and the Slovak Research and Development Agency under the contract No. APVV-15-0458. AFJM, JMM, and SMR are grateful for financial aid to NSERC (Canada). AFJM is also grateful for financial assistance to FQRNT (Quebec).
All Sky Automated Survey, www.astrouw.edu.pl/
Original HIPPARCOS astrometry solution resulted in π = 15.61(80) mas.
θH, θK - uniform disk angular diameter in the H and K passbands.
Times of observations not given but are consistent with out-of-eclipse magnitudes of Bolton & Herbst (1976).
The distance to the system was also optimized (defined primarily by the apparent size of the visual orbit and the size of the spectroscopic orbit).
R⊙ = 695,700 km, Teff⊙ = 5,772 K.
References
- Bennet, N. W. W., Evans, N. S., & Laing, J. D. 1963, R. Obs. Bull., 78 [Google Scholar]
- Berger, J.-P., Zins, G., Lazareff, B., et al. 2010, Proc. SPIE, 7734, 773435 [CrossRef] [Google Scholar]
- Bessell, M. S., & Brett, J. M. 1988, PASP, 100, 1134 [NASA ADS] [CrossRef] [Google Scholar]
- Binnendijk, L.A. 1960, Properties of double stars (Philadelphia: University of Pennsylvania Press) [Google Scholar]
- Bolton, C. T., & Herbst, W. 1976, AJ, 81, 339 [NASA ADS] [CrossRef] [Google Scholar]
- Boyajian, T. S., van Belle, G., & von Braun, K. 2014, AJ, 147, 47 [NASA ADS] [CrossRef] [Google Scholar]
- Claret, A., Dragomir, D., & Matthews, J. M. 2014, A&A, 567, A3 [NASA ADS] [CrossRef] [EDP Sciences] [Google Scholar]
- de Bruijne, J. H. J. 2012, Ap&SS, 341, 31 [NASA ADS] [CrossRef] [Google Scholar]
- Demarque, P., Woo, J.-H., Kim, Y.-C., & Yi, S. K. 2004, ApJS, 155, 667 [NASA ADS] [CrossRef] [Google Scholar]
- Feinstein, A., & Forte, J. C. 1974, PASP, 86, 284 [NASA ADS] [CrossRef] [Google Scholar]
- Fekel, F. C., Williamson, M. H., & Henry, G. W. 2011, AJ, 141, 145 [NASA ADS] [CrossRef] [Google Scholar]
- Gaia Collaboration (Brown, A. G. A., et al.) 2018, A&A, 616, A1 [NASA ADS] [CrossRef] [EDP Sciences] [Google Scholar]
- Gallenne, A., Mérand, A., Kervella, P., et al. 2015, A&A, 579, A68 [NASA ADS] [CrossRef] [EDP Sciences] [Google Scholar]
- Girardi, L., Bressan, A., Bertelli, G., & Chiosi, C. 2000, A&AS, 141, 371 [NASA ADS] [CrossRef] [EDP Sciences] [Google Scholar]
- Graczyk, D., Konorski, P., Pietrzyński, G., et al. 2017, ApJ, 837, 7 [Google Scholar]
- Gravity Collaboration (Abuter, R., Accardo, M., et al.) 2017, A&A, 602, A94 [NASA ADS] [CrossRef] [EDP Sciences] [Google Scholar]
- Gray, D. F. 2008, The Observation and Analysis of Stellar Photospheres (Cambridge: Cambridge University Press) [Google Scholar]
- Kervella, P., Thévenin, F., Di Folco, E., & Ségransan, D. 2004, A&A, 426, 297 [NASA ADS] [CrossRef] [EDP Sciences] [Google Scholar]
- Kervella, P., Bigot, L., Gallenne, A., & Thévenin, F. 2017, A&A, 597, A137 [NASA ADS] [CrossRef] [EDP Sciences] [Google Scholar]
- Kholopov, P. N., Samus, N. N., Kukarkina, N. P., Medvedeva, G. I., & Perova, N. B. 1981, Information Bulletin on Variable Stars, 1921 [Google Scholar]
- Lapeyrere, V., Kervella, P., Lacour, S., et al. 2014, Proc. SPIE, 9146, 91462D [Google Scholar]
- Le Bouquin, J.-B., Berger, J.-P., Lazareff, B., et al. 2011, A&A, 535, A67 [NASA ADS] [CrossRef] [EDP Sciences] [Google Scholar]
- Matthews, J. M., Kuschnig, R., Guenther, D. B., et al. 2004, Nature, 430, 51 [NASA ADS] [CrossRef] [PubMed] [Google Scholar]
- Mérand, A., Bordé, P., & Coudé du Foresto, V. 2005, A&A, 433, 1155 [NASA ADS] [CrossRef] [EDP Sciences] [Google Scholar]
- Mérand, A., Abuter, R., Aller-Carpentier, E., et al. 2014, Proc. SPIE, 9146, 91460J [CrossRef] [Google Scholar]
- Petrov, R. G., Malbet, F., Weigelt, G., et al. 2007, A&A, 464, 1 [NASA ADS] [CrossRef] [EDP Sciences] [Google Scholar]
- Popper, D. M. 1980, ARA&A, 18, 115 [NASA ADS] [CrossRef] [Google Scholar]
- Press, W. H., Flannery, B. P., & Teukolsky, S. A. 1986, Numerical recipes (Cambridge: Cambridge University Press) [Google Scholar]
- Pribulla, T., Rucinski, S. M., Latham, D. W., et al. 2010, Astron. Nachr., 331, 397 [NASA ADS] [CrossRef] [Google Scholar]
- Prša, A., Harmanec, P., Torres, G., et al. 2016, AJ, 152, 41 [NASA ADS] [CrossRef] [Google Scholar]
- Rieke, G. H., & Lebofsky, M. J. 1985, ApJ, 288, 618 [NASA ADS] [CrossRef] [Google Scholar]
- Rozelot, J.-P., & Neiner, C. 2009, Lect. Notes Phys., 765 [Google Scholar]
- Sen, H. K. 1948, Proc. Nat. Acad. Sci., 34, 311 [NASA ADS] [CrossRef] [Google Scholar]
- Skrutskie, M. F., Cutri, R. M., Stiening, R., et al. 2006, AJ, 131, 1163 [NASA ADS] [CrossRef] [Google Scholar]
- Southworth, J. 2015, ASP Conf. Ser., 496, 164 [NASA ADS] [Google Scholar]
- Southworth, J., Bruntt, H., & Buzasi, D. L. 2007, A&A, 467, 1215 [NASA ADS] [CrossRef] [EDP Sciences] [Google Scholar]
- Stassun, K. G., & Torres, G. 2016, ApJ, 831, L6 [NASA ADS] [CrossRef] [Google Scholar]
- Torres, G., Andersen, J., & Giménez, A. 2010, A&ARv, 18, 67 [Google Scholar]
- van Leeuwen, F. 2007, A&A, 474, 653 [NASA ADS] [CrossRef] [EDP Sciences] [Google Scholar]
- Walker, G., Matthews, J., Kuschnig, R., et al. 2003, PASP, 115, 1023 [NASA ADS] [CrossRef] [Google Scholar]
- Worthey, G., & Lee, H.-c. 2011, ApJS, 193, 1 [NASA ADS] [CrossRef] [EDP Sciences] [Google Scholar]
All Tables
Relative astrometric position, ΔX and ΔY, of the secondary component of V923 Sco determined from the VLTI observations.
Orbital elements of the visual orbit obtained from the VLTI, P - orbital period, e - eccentricity, i - inclination angle, T0 - time of periastron passage, ω - longitude of periastron, Ω - longitude of the ascending node, and a - semimajor axis.
Absolute parameters of the components of V923 Sco from the combined light-curve and radial-velocity curve solution.
All Figures
|
Fig. 1. Closure phases (left column) and squared visibilities (right column) of V923 Sco measured with GRAVITY on 2 July 2017 (HJD=2457936.587). The best fit CANDID binary star model is represented with red curves in each panel. The recorded photometric spectrum is also shown in the upper left panel before and after the correction of the telluric absorption lines. |
| In the text | |
|
Fig. 2. Best fits to the secondary (left) and primary (right) minimum of V923 Sco. The 2014 data are plotted with filled circles, the nonsaturated 2012 data with open triangles. For clarity the data errors are not shown during the primary minimum (smaller than the symbols). The phases correspond to the optimum ephemeris for the primary minimum in Table 2. The best fit assuming two limb-darkened spheres is plotted with a solid line. The dotted line corresponds to a simultaneous modeling of the light-curve, radial-velocity and visual-orbit data (Sect. 4). |
| In the text | |
|
Fig. 3. Relative orbit of the secondary component of V923 Sco and its best fit assuming spectroscopic elements (P,e, ω, T0) (top). The nodal line is plotted by dash dots. Character “A” shows the position of the ascending node. Close-up view of error ellipses (dot-dashed line) at 9 epochs are shown at bottom. The orbit is prograde (counterclockwise motion on the sky). North is up and east is left on both panels. |
| In the text | |
|
Fig. 4. Hertzsprung–Russell diagram for the components of V923 Sco. Left panel: isochrones and evolutionary tracks of Girardi et al. (2000); right panel: those of Demarque et al. (2004). The tracks assuming convective overshooting and solar metallicity were selected in both cases. The temperature uncertainties were set to 200 K. The absolute parameters of the components correspond to the combined solution of MOST light curve and published radial-velocity data. |
| In the text | |
|
Fig. 5. Mass-radius diagram for V923 Sco (large symbols). The measurements are compared to theoretical isochrones of Girardi et al. (2000) for 100 Ma to 2 Ga for solar metallicity (Y = 0.70, Z = 0.02). The tracks assuming convective overshooting were selected. The vectors connect the positions of secondary to primary components in other well-studied detached binaries in DEBcat of Southworth (2015). |
| In the text | |
Current usage metrics show cumulative count of Article Views (full-text article views including HTML views, PDF and ePub downloads, according to the available data) and Abstracts Views on Vision4Press platform.
Data correspond to usage on the plateform after 2015. The current usage metrics is available 48-96 hours after online publication and is updated daily on week days.
Initial download of the metrics may take a while.