Fig. 2.
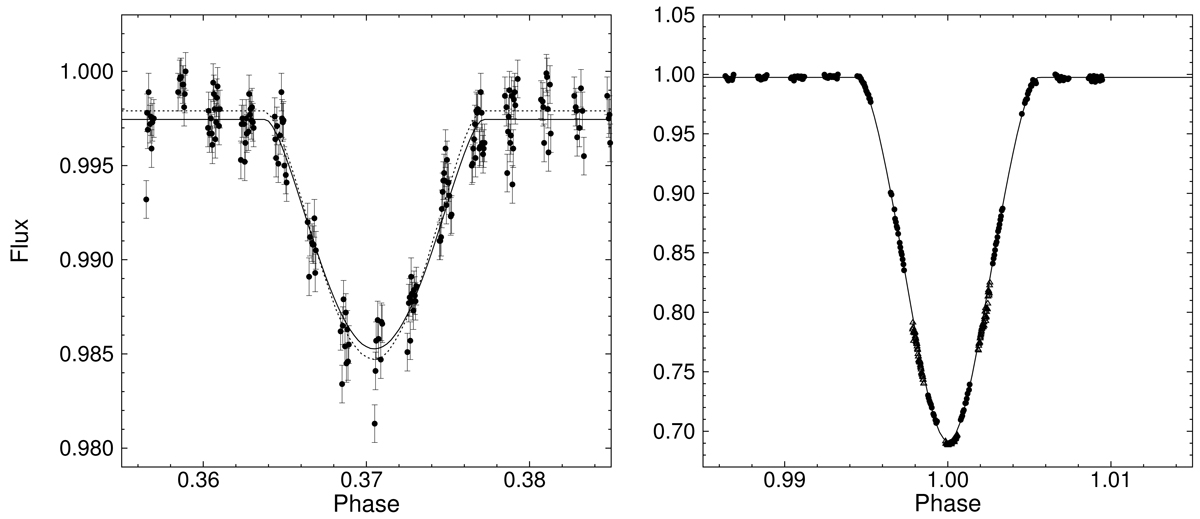
Best fits to the secondary (left) and primary (right) minimum of V923 Sco. The 2014 data are plotted with filled circles, the nonsaturated 2012 data with open triangles. For clarity the data errors are not shown during the primary minimum (smaller than the symbols). The phases correspond to the optimum ephemeris for the primary minimum in Table 2. The best fit assuming two limb-darkened spheres is plotted with a solid line. The dotted line corresponds to a simultaneous modeling of the light-curve, radial-velocity and visual-orbit data (Sect. 4).
Current usage metrics show cumulative count of Article Views (full-text article views including HTML views, PDF and ePub downloads, according to the available data) and Abstracts Views on Vision4Press platform.
Data correspond to usage on the plateform after 2015. The current usage metrics is available 48-96 hours after online publication and is updated daily on week days.
Initial download of the metrics may take a while.