Fig. 1.
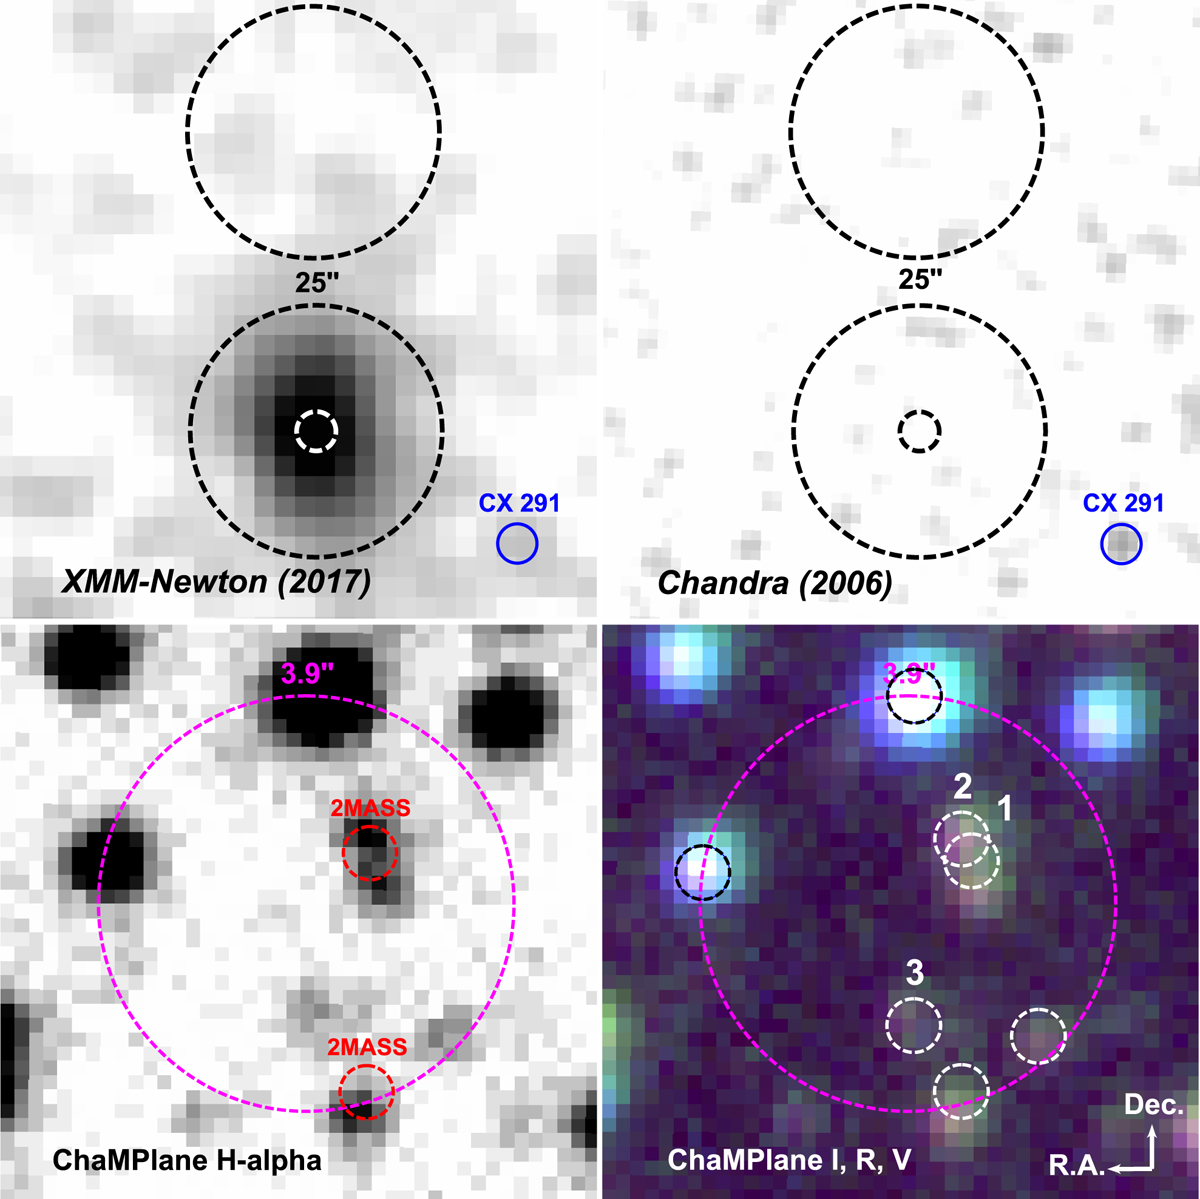
Top left: XMM-Newton EPIC 1–2 keV flux image (from 2017-10-07, 4 × 4″ pixel size, smoothed by a 2-pixel Gaussian). Circular extraction regions (25″ radius) of source and background counts (black dashed), 3σ positional uncertainty (white dashed). Top right: Chandra ACIS-I 1–2 keV flux image (from 2006-10-30, 2 × 2″ pixel size, smoothed by a 2-pixel Gaussian). The blue circle indicates a source from the Jonker et al. (2014) Chandra catalogue. Bottom left: zoomed ChaMPlane (Grindlay et al. 2003) Hα image (red circles: 2MASS sources, magenta circle: 3σ X-ray positional uncertainty). Bottom right: ChaMPlane colour band image (red: I, green: R, blue: V). Small circles are correlated sources from Wevers et al. (2016), and the three closest are numbered.
Current usage metrics show cumulative count of Article Views (full-text article views including HTML views, PDF and ePub downloads, according to the available data) and Abstracts Views on Vision4Press platform.
Data correspond to usage on the plateform after 2015. The current usage metrics is available 48-96 hours after online publication and is updated daily on week days.
Initial download of the metrics may take a while.