Free Access
Fig. 7.
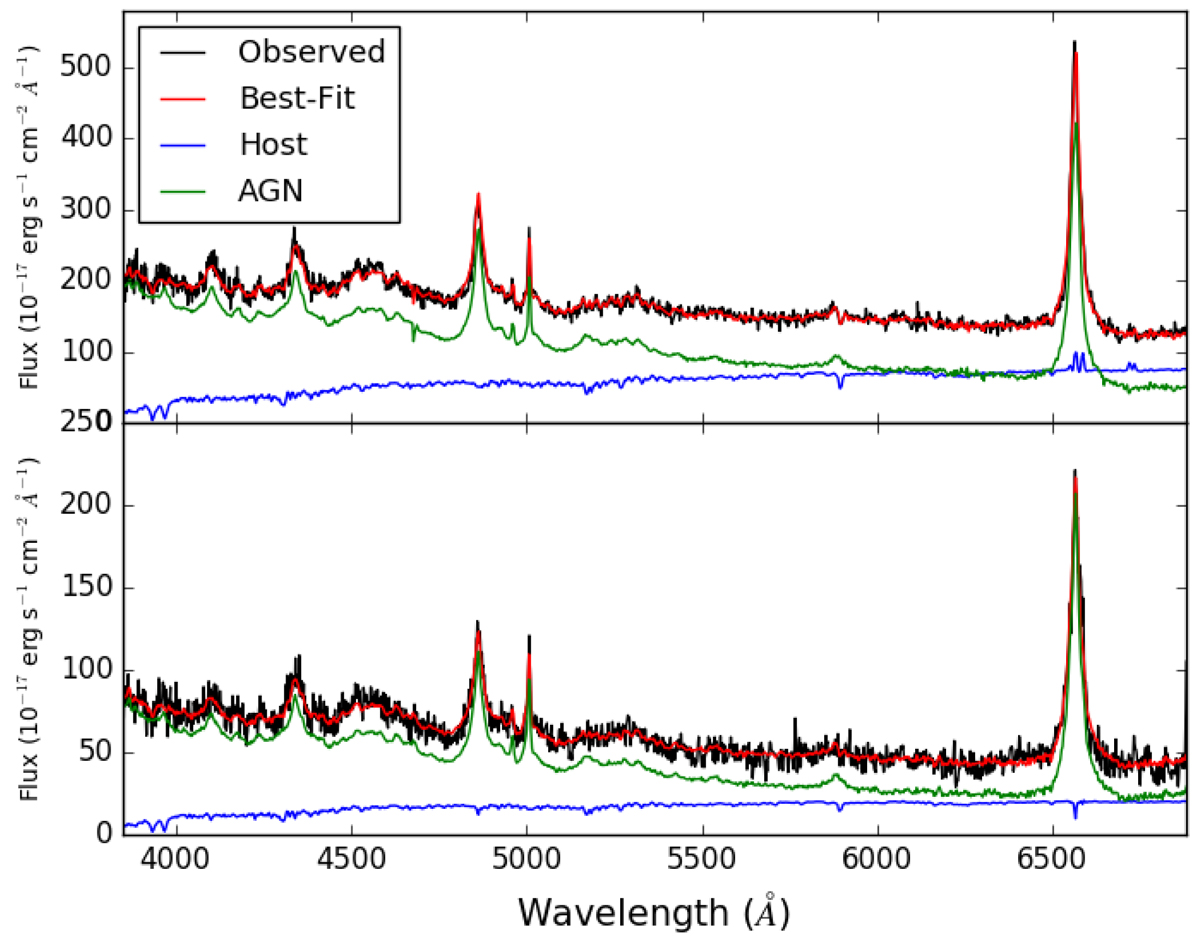
Decompositions of AGN and host galaxy in spectra 6dFGS gJ065017.5-380514 (top panel) and 6dFGS gJ084510.2-073205 (bottom panel). The black line shows the observed spectrum, the red line shows the best-fitted result, the green line shows the AGN component, and the blue line shows the stellar contribution.
Current usage metrics show cumulative count of Article Views (full-text article views including HTML views, PDF and ePub downloads, according to the available data) and Abstracts Views on Vision4Press platform.
Data correspond to usage on the plateform after 2015. The current usage metrics is available 48-96 hours after online publication and is updated daily on week days.
Initial download of the metrics may take a while.