Free Access
Fig. 5.
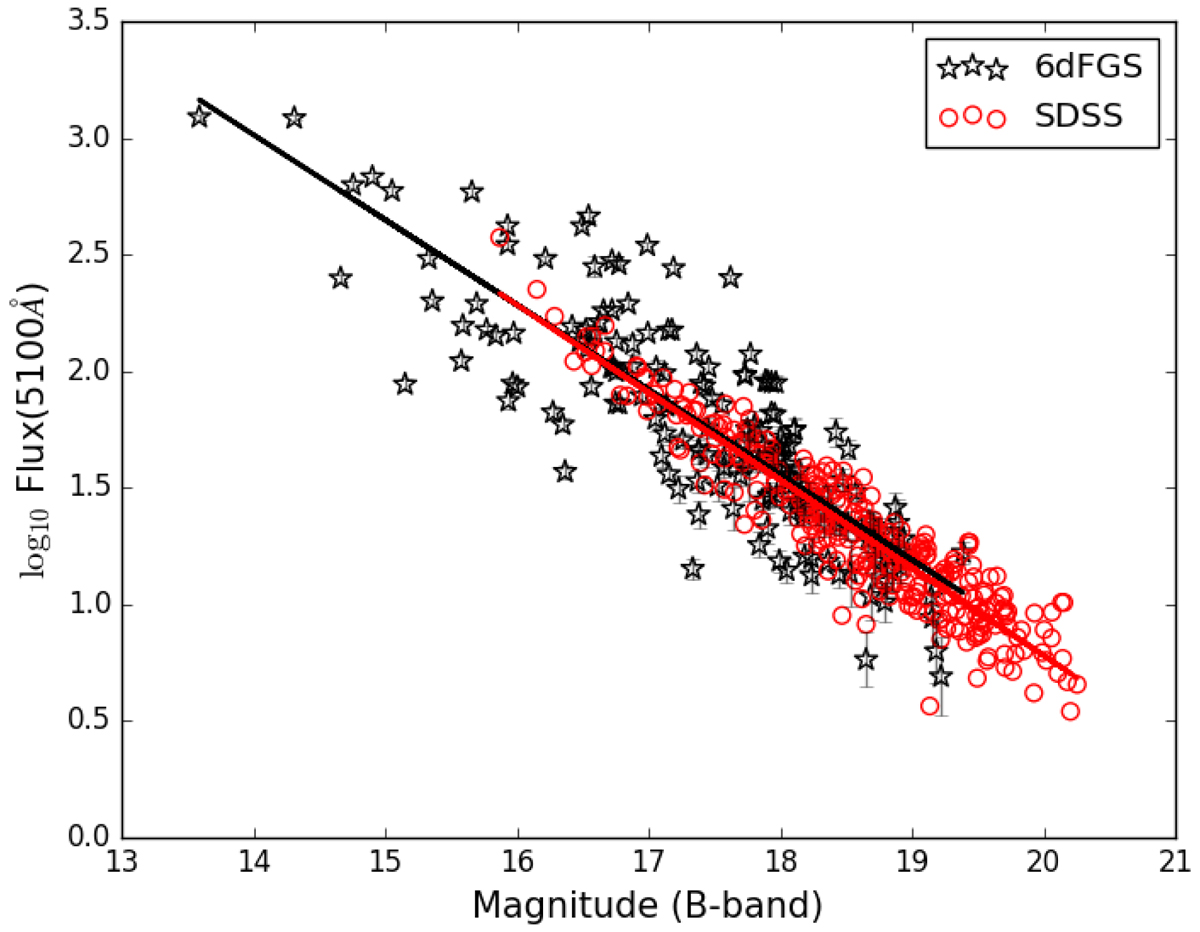
Relation of the mean flux at 5100 Å and the magnitude on B-band. The black stars and line are data from the 6dFGS sample, the red circles and line are data from the SDSS sample in Cracco et al. (2016).
Current usage metrics show cumulative count of Article Views (full-text article views including HTML views, PDF and ePub downloads, according to the available data) and Abstracts Views on Vision4Press platform.
Data correspond to usage on the plateform after 2015. The current usage metrics is available 48-96 hours after online publication and is updated daily on week days.
Initial download of the metrics may take a while.