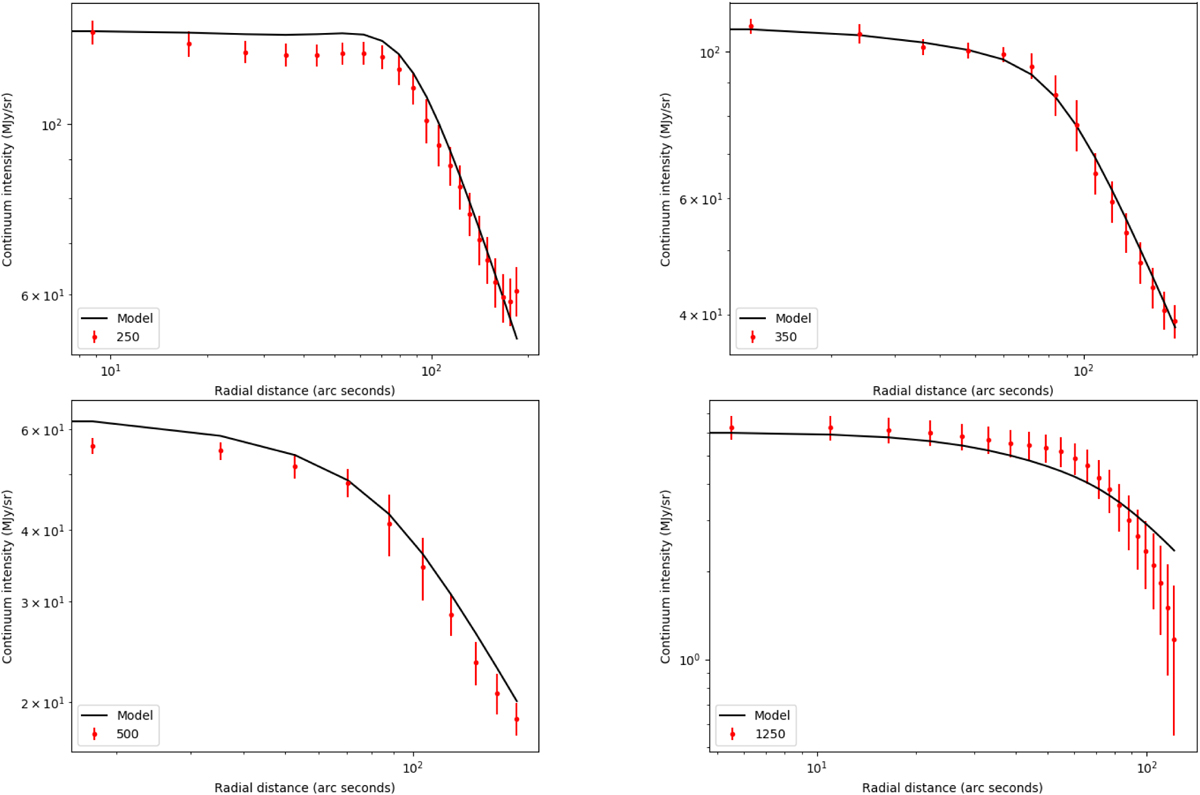
Fig. 6

Continuum fit results along with the radial profiles for the continuum emission. The emission at 250 μm (top left), the emission at 350 μm (top right), the emission at 500 μm (bottom left), and the emission at 1.25 mm (bottom right). The black lines represent the emission computed from the best-fit model, while the red dots represent the continuum intensity along the southwest cut described in Sect. 3. The error bars displayed are the quadratic sum of the mean rms noise for each map and the standard deviation of all the pixels within one beam.
Current usage metrics show cumulative count of Article Views (full-text article views including HTML views, PDF and ePub downloads, according to the available data) and Abstracts Views on Vision4Press platform.
Data correspond to usage on the plateform after 2015. The current usage metrics is available 48-96 hours after online publication and is updated daily on week days.
Initial download of the metrics may take a while.


