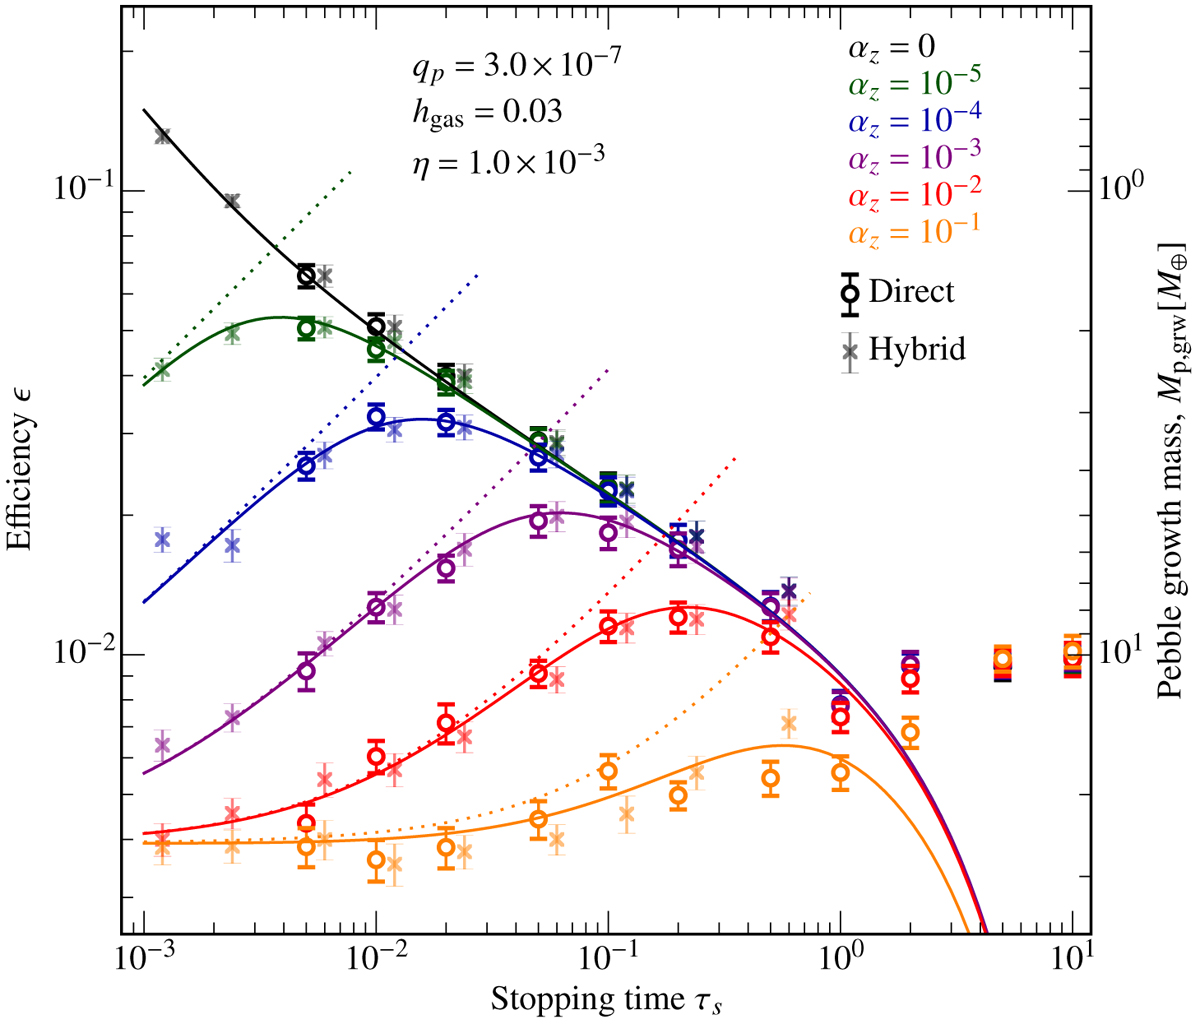
Fig. 4

Pebble accretion efficiency vs dimensionless stopping time for several values of the vertical turbulence strength, parameterized by αz (colors). Open symbols give ϵ obtained from directly integrating the stochastic equation of motion, while crosses give the results from the hybrid algorithm. Crosses are offset by 20% to the right for clarity. Error bars correspond to the Poisson counting error on the number of hits. For αz = 0 the triangles give ε resulting from the local calculations and the black line gives our fit to the 2D limit (ϵ2D), which we obtained in Paper I. The dotted lines gives ϵ3D accounting just for the density correction Eq. (22). The colored solid lines give ε accounting for all 3D/2D-effects (Eq. (40)) as explained in the main text. The right y-axis converts ε into the pebble growth mass – the total amount of pebbles needed to e-fold the mass of the planet – assuming a solar-mass star.
Current usage metrics show cumulative count of Article Views (full-text article views including HTML views, PDF and ePub downloads, according to the available data) and Abstracts Views on Vision4Press platform.
Data correspond to usage on the plateform after 2015. The current usage metrics is available 48-96 hours after online publication and is updated daily on week days.
Initial download of the metrics may take a while.


