Fig. 9
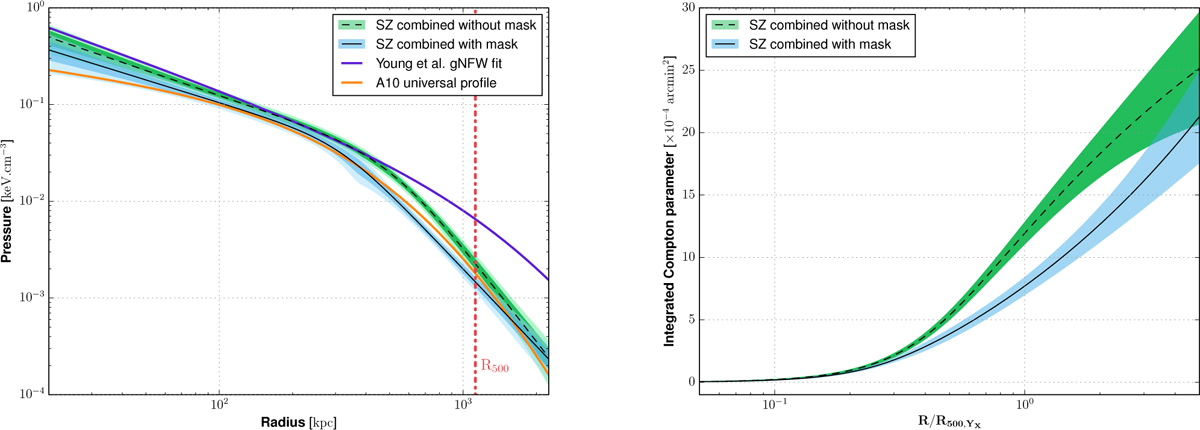
Left:comparison of the gNFW pressure profiles fitted on the pressure points constrained from a non-parametric deprojection of the tSZ data with (blue) and without (green) masking the over-pressure region. The Bolocam data are used along with the MUSTANG, NIKA2, and Planck data for the estimation of the green profile. In this case, the pressure is significantly higher than the constraints obtained masking the over-pressure between 500 and 900 kpc because of the excess of thermal pressure within the south-west region of PSZ2 G144.83+25.11. The pressure profile from Young et al. (2015) as well as the universal pressure profile from Arnaud et al. (2010; A10) are also shown in magenta and orange, respectively. The red dashed line shows an estimate of
R500 computed using the A10 profile, the AMI integrated Compton parameter, and the scaling relation used in Planck Collaboration XX (2014). Right: profiles of the spherically integrated Compton parameter computed from the pressure profiles obtained with (blue) and without (green) masking the over-pressure region. The radius has been normalized by
![]() constrained by XMM-Newton.
constrained by XMM-Newton.
Current usage metrics show cumulative count of Article Views (full-text article views including HTML views, PDF and ePub downloads, according to the available data) and Abstracts Views on Vision4Press platform.
Data correspond to usage on the plateform after 2015. The current usage metrics is available 48-96 hours after online publication and is updated daily on week days.
Initial download of the metrics may take a while.