Fig. 8
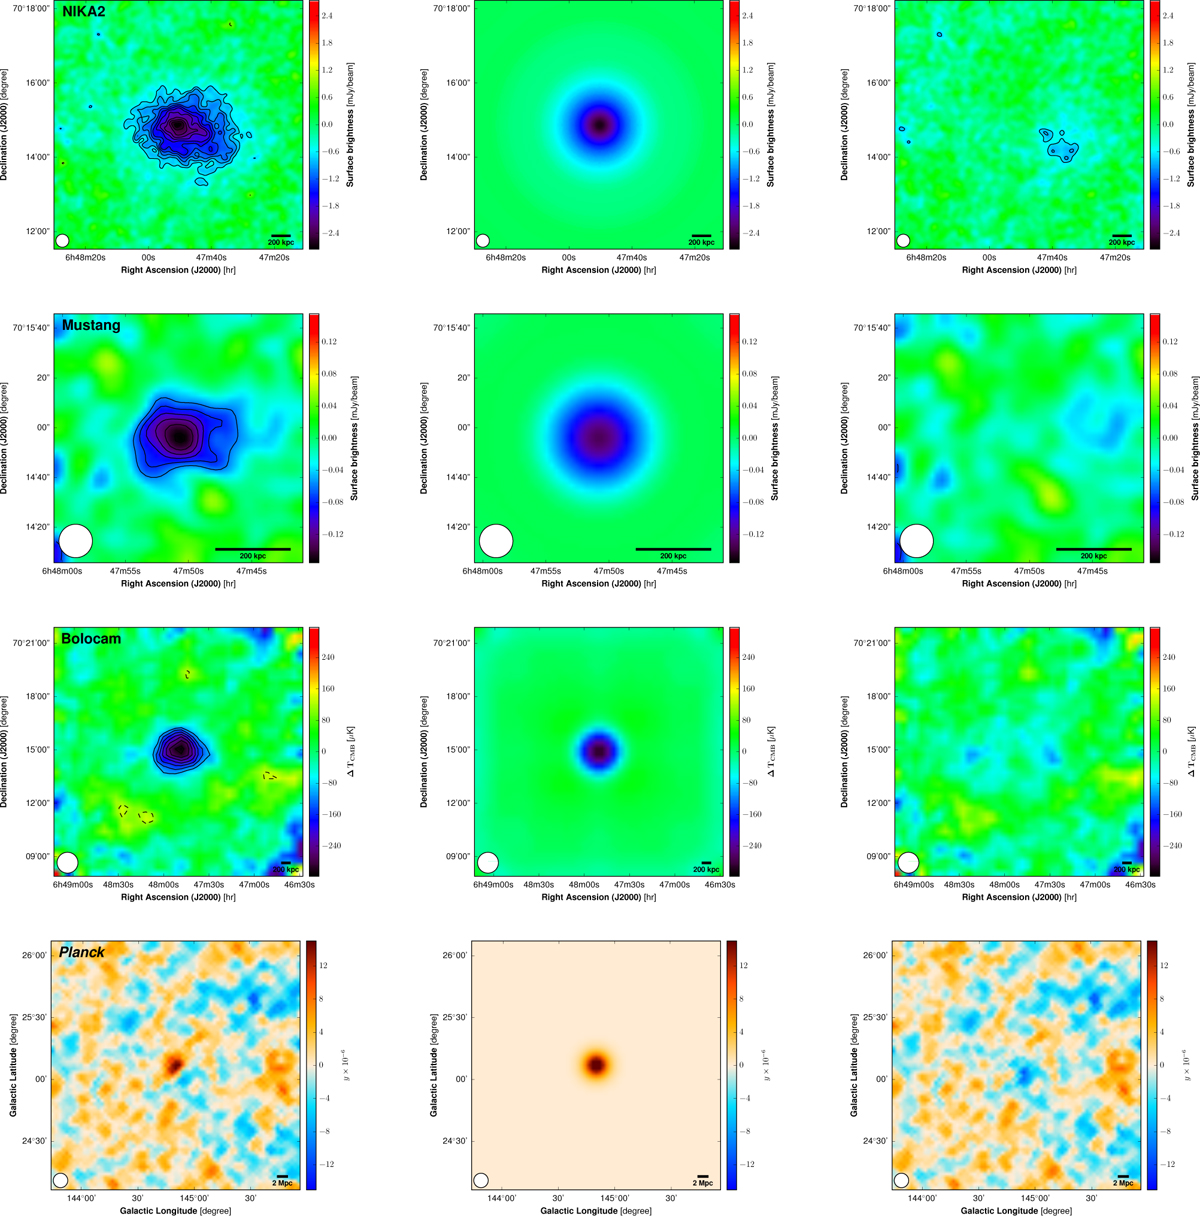
From top to bottom: NIKA2, MUSTANG, Bolocam, and Planck tSZ data (left), maximum likelihood tSZ map (middle), and residual (right) computed from an MCMC analysis based on a non-parametric model and masking the over-pressure region in the south-west of PSZ2 G144.83+25.11. The Bolocam row is shown as a cross-check even if this data is not used for this analysis. The significance contours start at 3σ with 1σ increments. A 4σ tSZ signal isidentified in the NIKA2 residual map within the region that is masked for this analysis.
Current usage metrics show cumulative count of Article Views (full-text article views including HTML views, PDF and ePub downloads, according to the available data) and Abstracts Views on Vision4Press platform.
Data correspond to usage on the plateform after 2015. The current usage metrics is available 48-96 hours after online publication and is updated daily on week days.
Initial download of the metrics may take a while.