Fig. 5
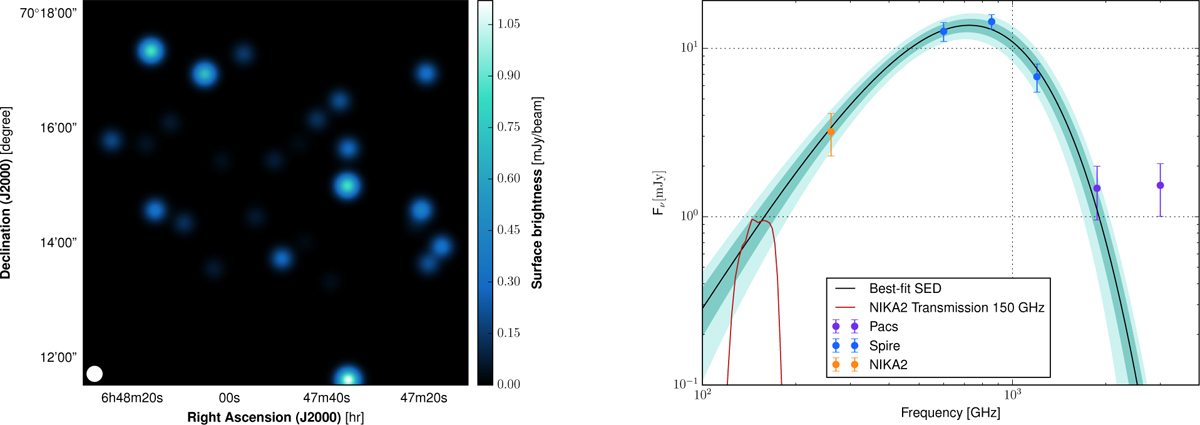
Left: map of the expected flux at 150 GHz for each submillimeter source identified in the Herschel and NIKA2 channels. Each point source is modeled by a 2D Gaussian function of 17.7 arcsec FWHM and with an amplitude given by the last column of Table 2. Right: SED of the submillimeter source SMG28 (see Table 2) identified in the NIKA2 map at 260 GHz. The fluxes measured in the Herschel maps are color corrected using both PACS (Poglitsch et al. 2010) and SPIRE calibration files. The best-fit SED model (black solid line) is integrated in the NIKA2 bandpass at 150 GHz (red solid line) to estimate the expected flux at this frequency. The 1σ and 2σ uncertainties on the best-fit SED are shown as dark and light blue-green shaded areas.
Current usage metrics show cumulative count of Article Views (full-text article views including HTML views, PDF and ePub downloads, according to the available data) and Abstracts Views on Vision4Press platform.
Data correspond to usage on the plateform after 2015. The current usage metrics is available 48-96 hours after online publication and is updated daily on week days.
Initial download of the metrics may take a while.