Fig. 3
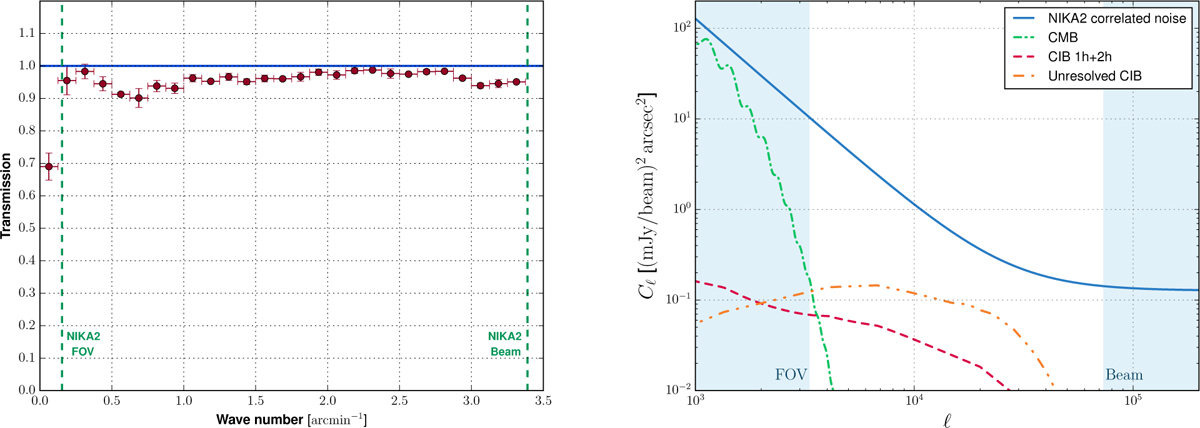
Left: NIKA2 150 GHz data reduction transfer function as a function of the angular frequency. The uncertainties are computed using the dispersion of the transfer functions computed from different simulations. The 150 GHz beam cutoff and the size of the NIKA2 FOV are also represented by green dashed lines. Right: angular power spectrum of the NIKA2 residual correlated noise (blue), CMB primary anisotropies (green), CIB (red), and unresolved CIB (orange) at 150 GHz. The NIKA2 beam and transfer function filtering has been applied to the contaminant power spectra. The blue regions show the angular scales that are larger and smaller than the NIKA2 FOV and beam, respectively.
Current usage metrics show cumulative count of Article Views (full-text article views including HTML views, PDF and ePub downloads, according to the available data) and Abstracts Views on Vision4Press platform.
Data correspond to usage on the plateform after 2015. The current usage metrics is available 48-96 hours after online publication and is updated daily on week days.
Initial download of the metrics may take a while.