Fig. 2
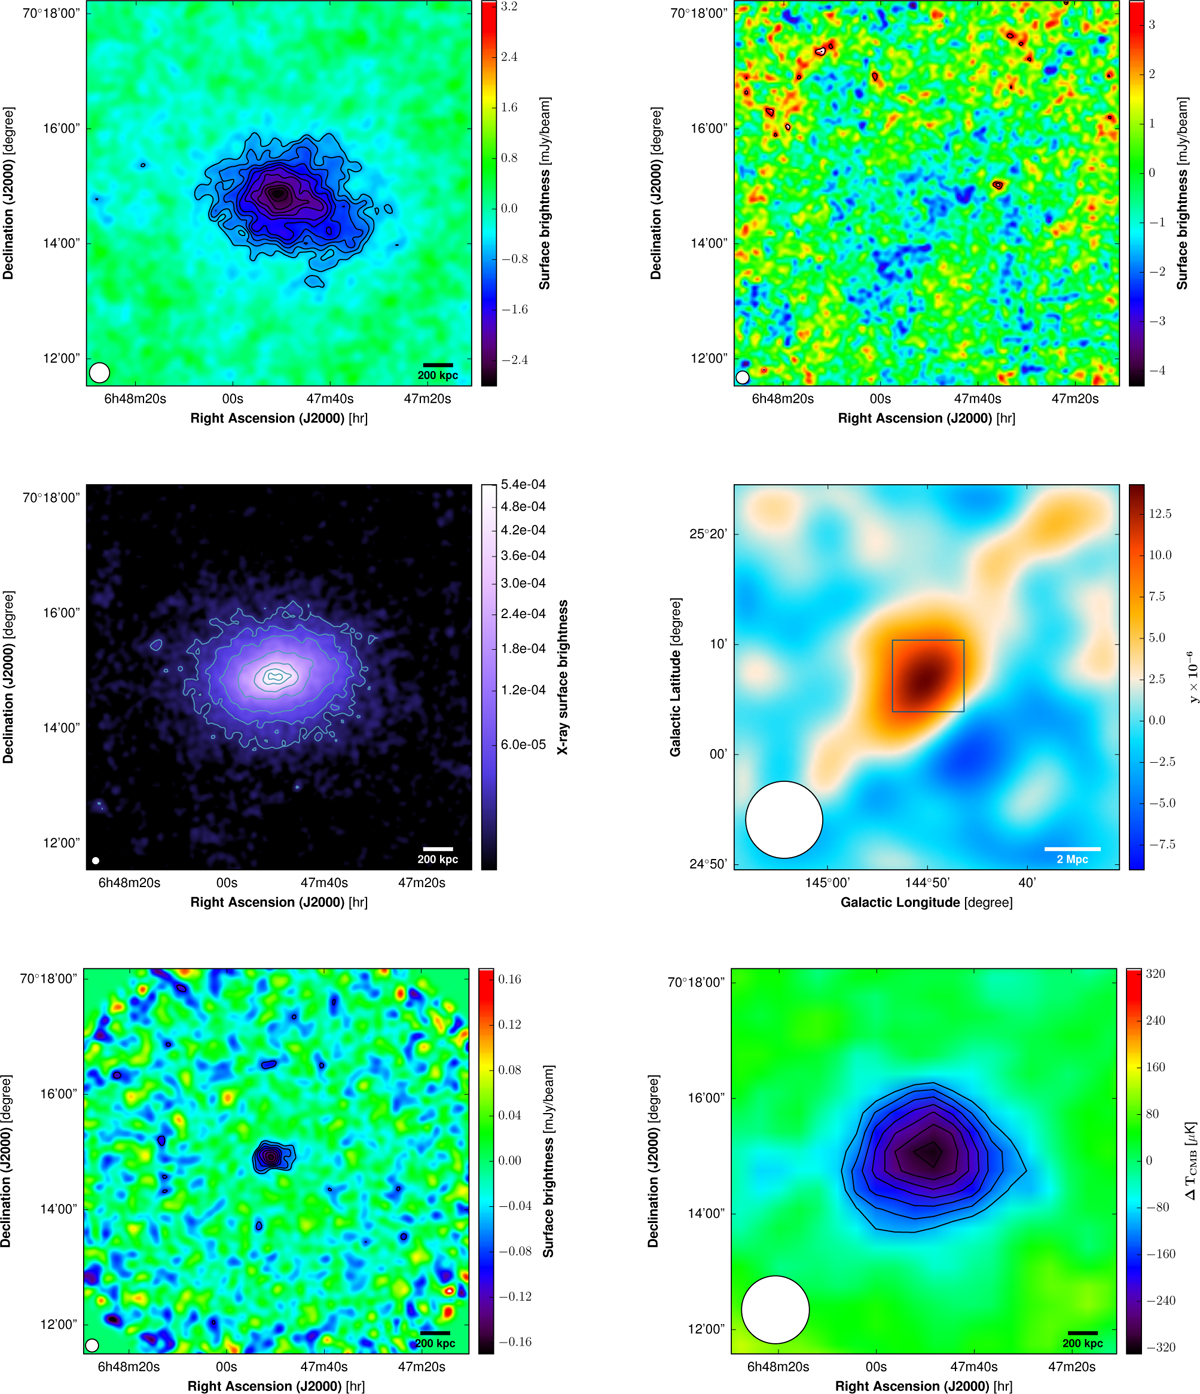
Top: NIKA2 surface brightness maps at 150 GHz (left) and 260 GHz (right). For display purposes, the maps are smoothed with an additional 10 and 6 arcsec FWHM Gaussian filter at 150 and 260 GHz, respectively. The NIKA2 effective beam FWHMs are represented as white disks in the bottom left-hand corner of the maps. The considered FOV is 6.7 arcmin wide. Middle: XMM-Newton X-ray photon count map (left) of PSZ2 G144.83+25.11 obtained after subtracting both the background and point sources and correcting for vignetting. The contours are given for X-ray counts of 1, 2, 4, 10, 20, 30, and 35. The map has been smoothed with an additional 6 arcsec FWHM Gaussian filter and colors are displayed using a square-root scale for display purposes. Planck map (right) of the Compton parameter of PSZ2 G144.83+25.11 in a wider FOV of 35 arcmin (Planck Collaboration XXII 2016). The dark blue square gives the size of the region displayed for all the other maps in the figure. Bottom: MUSTANG map (left) of the PSZ2 G144.83+25.11 surface brightness at 90 GHz smoothed by an additional 9 arcsec FWHM Gaussian filter for display purposes (Young et al. 2015). Bolocam map (right) of the PSZ2 G144.83+25.11 surface brightness at 140 GHz smoothed by an additional 40 arcsec FWHM Gaussian filter (Sayers et al. 2013). For each tSZ map, the black contours give the significance of the measured signal starting at 3σ with 1σ spacing. The FWHMs of each instrument are shown as white disks in the bottom left-hand corner of the maps.
Current usage metrics show cumulative count of Article Views (full-text article views including HTML views, PDF and ePub downloads, according to the available data) and Abstracts Views on Vision4Press platform.
Data correspond to usage on the plateform after 2015. The current usage metrics is available 48-96 hours after online publication and is updated daily on week days.
Initial download of the metrics may take a while.