Fig. 12
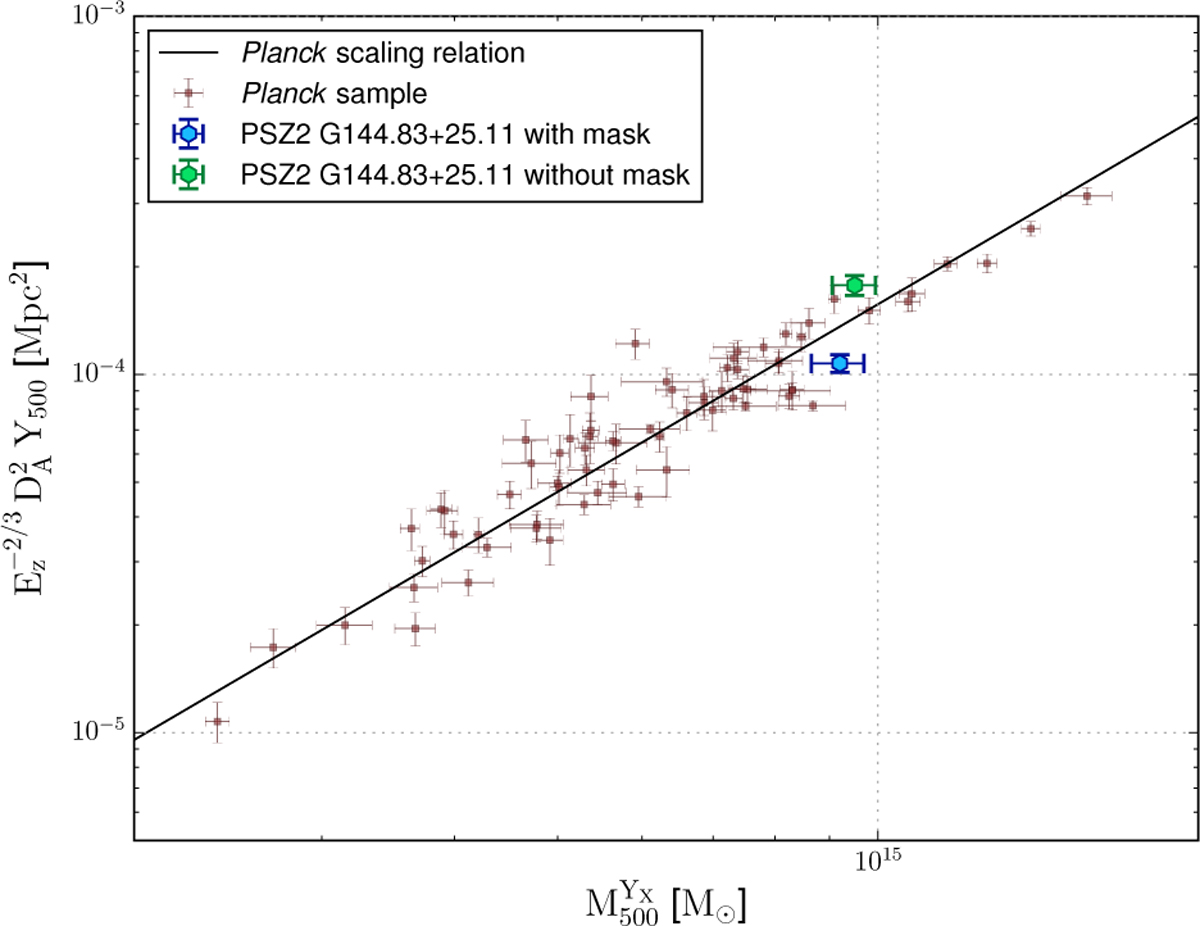
Planck Y500−M500 scaling relation (black line; Planck Collaboration XX 2014) together with the 71 points (red squares) used for its calibration from the study of low-redshift clusters (z < 0.45). The two estimates of Y500 based on the joint tSZ analysis with and without masking the over-pressure region in PSZ2 G144.83+25.11 are shown with the blue and the green points, respectively. All the masses are estimated using the YX mass proxy.
Current usage metrics show cumulative count of Article Views (full-text article views including HTML views, PDF and ePub downloads, according to the available data) and Abstracts Views on Vision4Press platform.
Data correspond to usage on the plateform after 2015. The current usage metrics is available 48-96 hours after online publication and is updated daily on week days.
Initial download of the metrics may take a while.